Fig. 1
Download original image
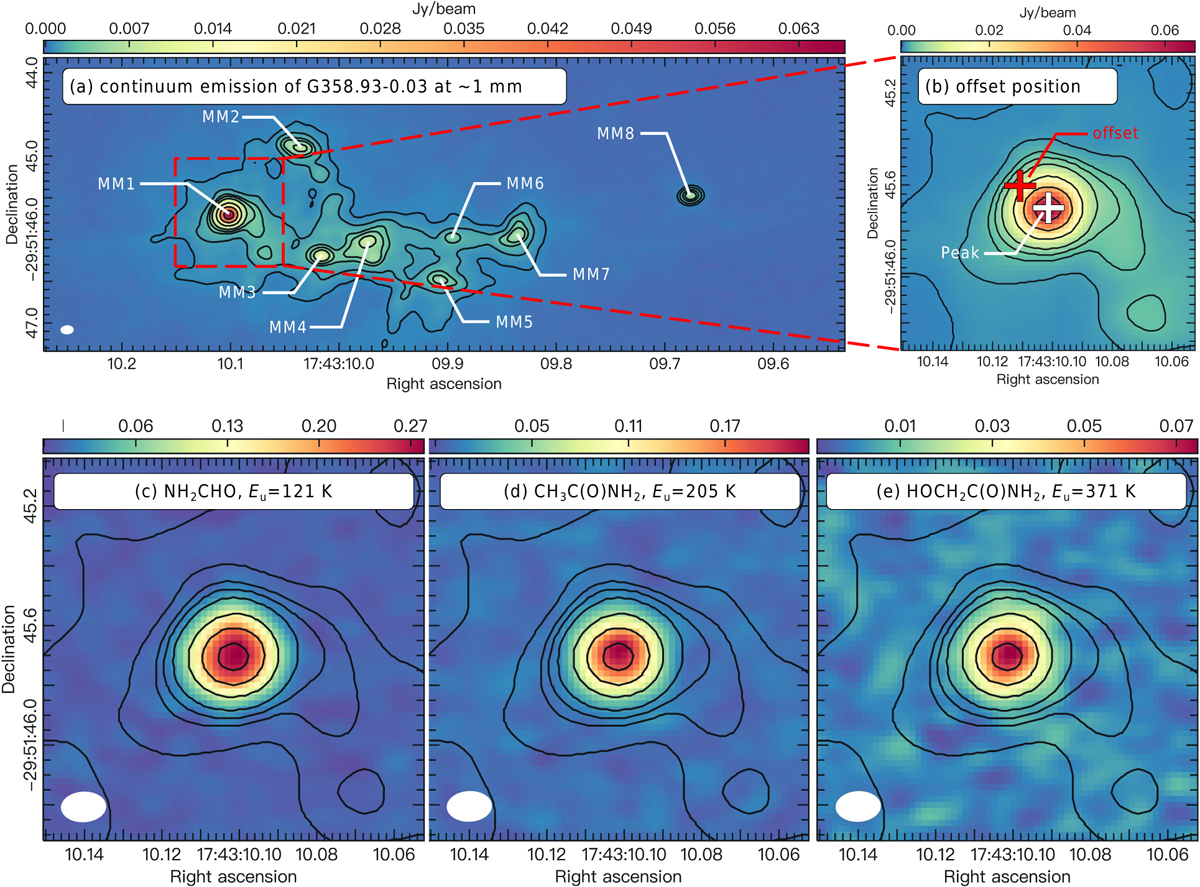
(a) 1 mm continuum image of G358.93-0.03. Contour levels correspond to (20, 40, 80, 120, 200, 500, 1000, 1700) × σ, where σ is the rms noise level. The white ellipse in the lower-left corner indicates the synthesized beam of 0.15″×0.1″ (position angle –87.1◦). (b) Enlarged view of G358.93 MM1. The continuum peak is marked by a white cross, and the offset extraction position used for spectral analysis is marked by a red cross. (c–e) Integrated intensity (moment-0) maps of NH2CHO, CH3C(O)NH2, and syn-HOCH2C(O)NH2 toward G358.93 MM1, overlaid with the 1 mm continuum emission contours from panel (a). The color scale unit is Jy beam−1 km s−1.
Current usage metrics show cumulative count of Article Views (full-text article views including HTML views, PDF and ePub downloads, according to the available data) and Abstracts Views on Vision4Press platform.
Data correspond to usage on the plateform after 2015. The current usage metrics is available 48-96 hours after online publication and is updated daily on week days.
Initial download of the metrics may take a while.