


Fig. 8.
Download original image
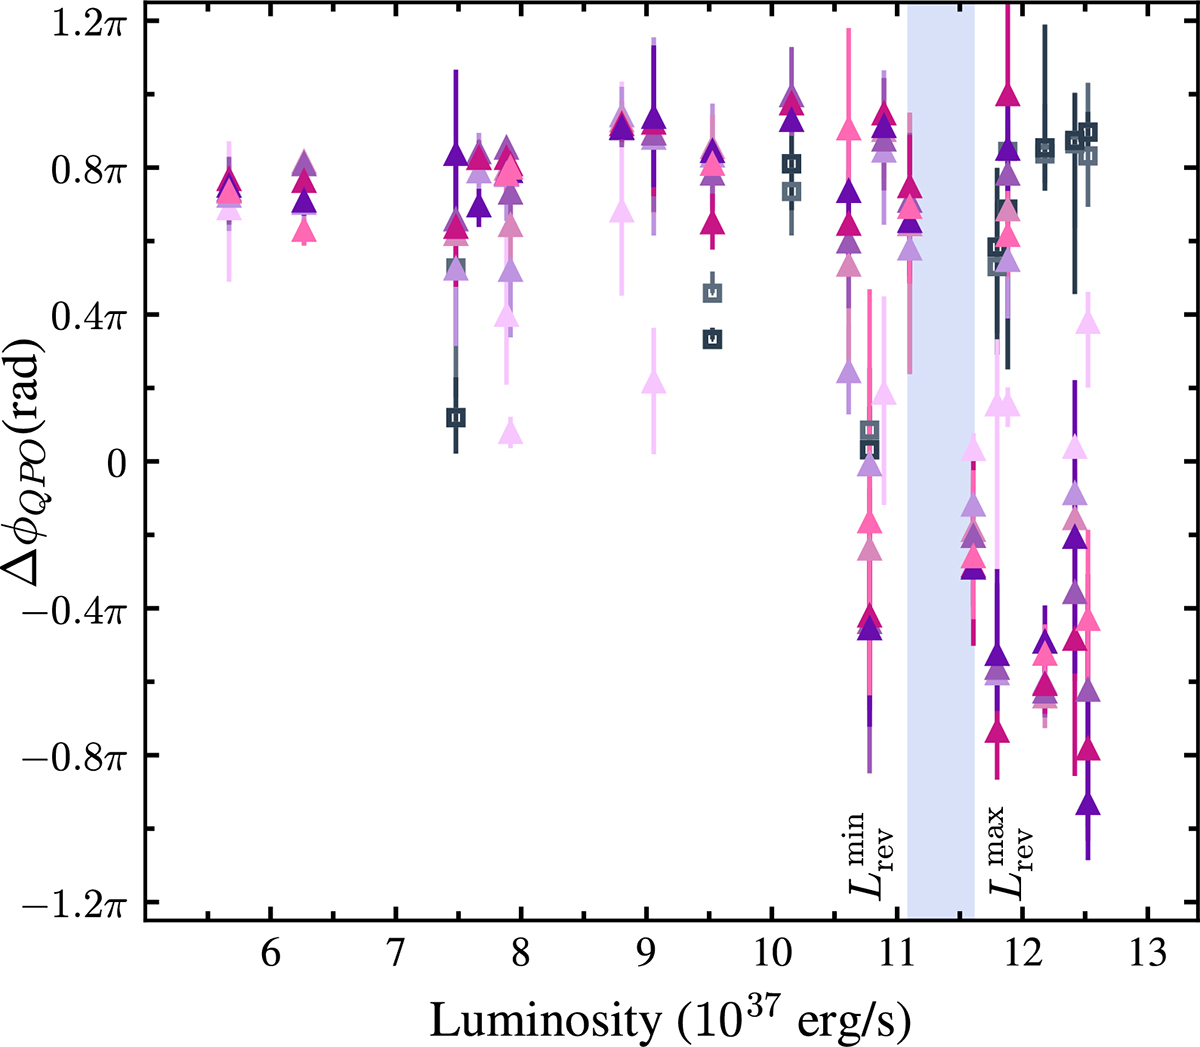
Luminosity–phase–lag relation of the millihertz QPO in 1A 0535+262. ΔϕQPO in different energy bands (colours as in Fig. 5) versus bolometric luminosity. The light blue shaded region indicates the transition range, Lrev ∼ 1.11 − 1.16 × 1038. A transient soft lag appears only for L ≳ Lrev. All QPOs were fitted with a single-component model.
Current usage metrics show cumulative count of Article Views (full-text article views including HTML views, PDF and ePub downloads, according to the available data) and Abstracts Views on Vision4Press platform.
Data correspond to usage on the plateform after 2015. The current usage metrics is available 48-96 hours after online publication and is updated daily on week days.
Initial download of the metrics may take a while.