


Fig. 7.
Download original image
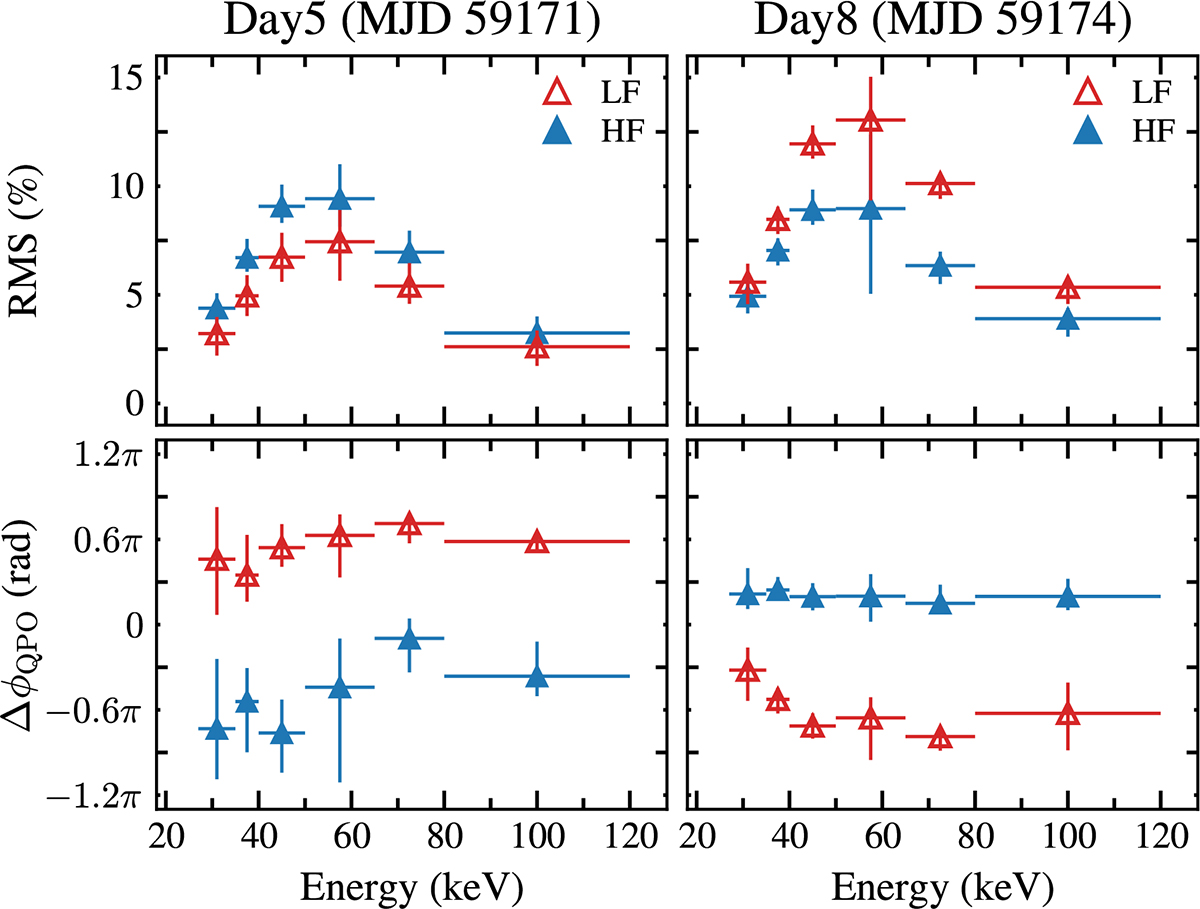
Energy dependence of the double-peak QPO properties in 1A 0535+262 on MJD 59171 and 59174. Top panels: rms amplitude as a function of energy. Bottom panels: Phase lags (ΔϕQPO). The filled blue and open red triangles represent the HF and LF QPOs, respectively. The differences in both rms amplitude (∼4.5% on Day 5 and ∼6.6% on Day 8) and phase lag (∼0.9π rad) remain approximately constant across the 27–120 keV energy range.
Current usage metrics show cumulative count of Article Views (full-text article views including HTML views, PDF and ePub downloads, according to the available data) and Abstracts Views on Vision4Press platform.
Data correspond to usage on the plateform after 2015. The current usage metrics is available 48-96 hours after online publication and is updated daily on week days.
Initial download of the metrics may take a while.