


Fig. 6.
Download original image
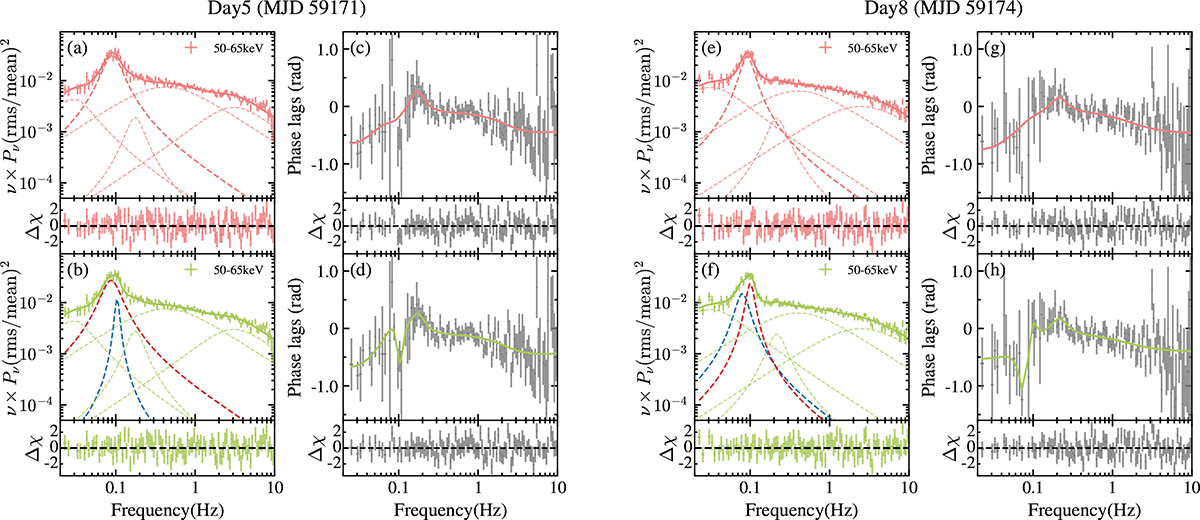
Single- and double-QPO fits to the HXMT/HE 50–65 keV subject band on Day 5 (MJD 59171; panels a–d) and Day 8 (MJD 59174; panels e–h), shown for the PS νPν and the corresponding phase-lag spectrum relative to the HXMT/LE 1–3 keV reference band. Panels (a), (c), (e), and (g): Single-QPO model (five Lorentzians; solid red curves). Panels (b), (d), (f), and (h): Double-QPO model (six Lorentzians; solid green curves). Dashed curves denote individual Lorentzian components; in the double-QPO model, the LF and HF QPO peaks are highlighted with dashed red and blue curves, respectively, consistent with Fig. 7. Residuals (Δχ) are shown beneath each spectrum.
Current usage metrics show cumulative count of Article Views (full-text article views including HTML views, PDF and ePub downloads, according to the available data) and Abstracts Views on Vision4Press platform.
Data correspond to usage on the plateform after 2015. The current usage metrics is available 48-96 hours after online publication and is updated daily on week days.
Initial download of the metrics may take a while.