


Fig. 5.
Download original image
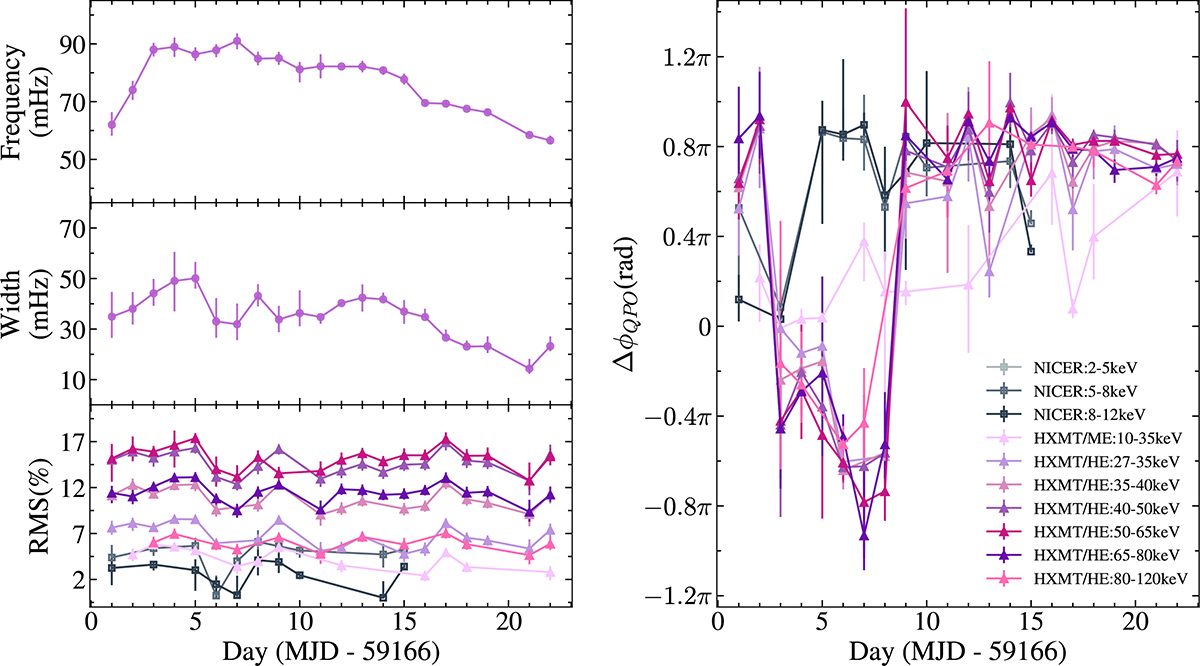
Time evolution of millihertz QPO parameters in 1A 0535+262 during the 2020 outburst. Left three panels: Centroid frequency, HWHM, and rms amplitude of the QPOs as functions of MJD. Right panel: QPO phase lag (ΔϕQPO) for the energy bands listed in the legend, measured relative to 0.2–2 keV for NICER and 1–3 keV for HXMT. NICER data are shown in grey and HXMT data in violet. The QPO signal in each energy band was fitted with a single Lorentzian component.
Current usage metrics show cumulative count of Article Views (full-text article views including HTML views, PDF and ePub downloads, according to the available data) and Abstracts Views on Vision4Press platform.
Data correspond to usage on the plateform after 2015. The current usage metrics is available 48-96 hours after online publication and is updated daily on week days.
Initial download of the metrics may take a while.