


Fig. 4.
Download original image
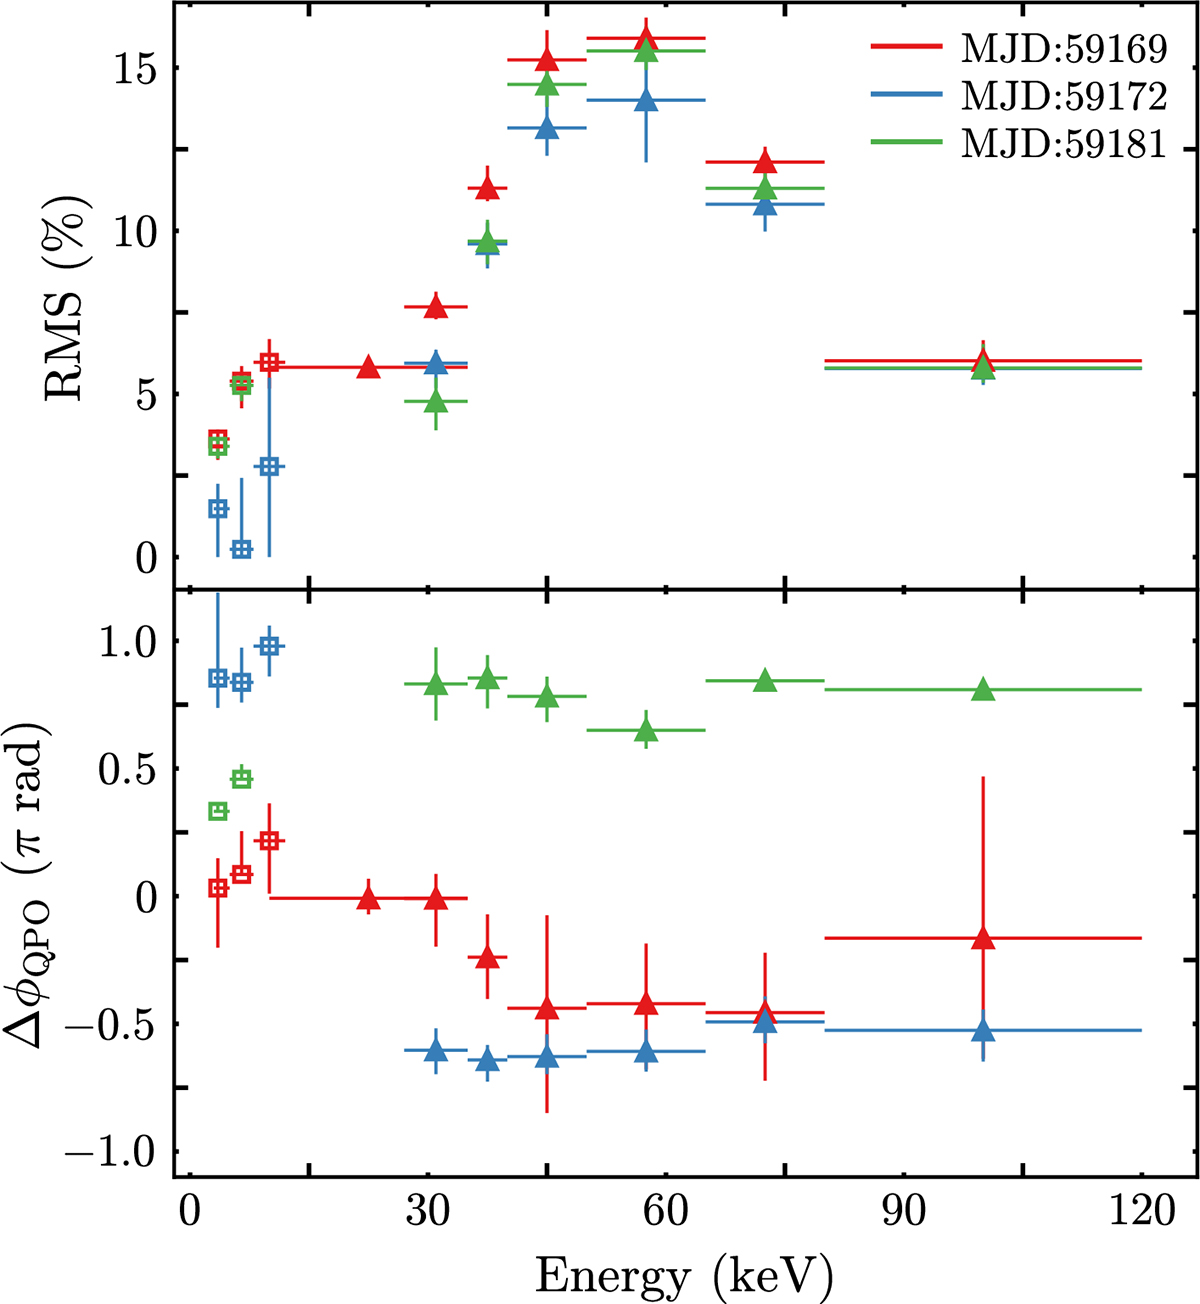
Energy dependence of the millihertz QPO properties in 1A 0535+262 for three epochs (MJD 59169, 59172, and 59181; corresponding to Days 3, 6, and 15). Top panel: Fractional rms amplitude as a function of energy. Bottom panel: Energy-resolved phase lag, ΔϕQPO, measured with respect to the reference band. Triangles and squares denote HXMT and NICER measurements, respectively. Colours indicate the outburst phase: red (rise), blue (peak), and green (decay). In each energy band, the QPO was modelled with a single Lorentzian component.
Current usage metrics show cumulative count of Article Views (full-text article views including HTML views, PDF and ePub downloads, according to the available data) and Abstracts Views on Vision4Press platform.
Data correspond to usage on the plateform after 2015. The current usage metrics is available 48-96 hours after online publication and is updated daily on week days.
Initial download of the metrics may take a while.