


Fig. 2.
Download original image
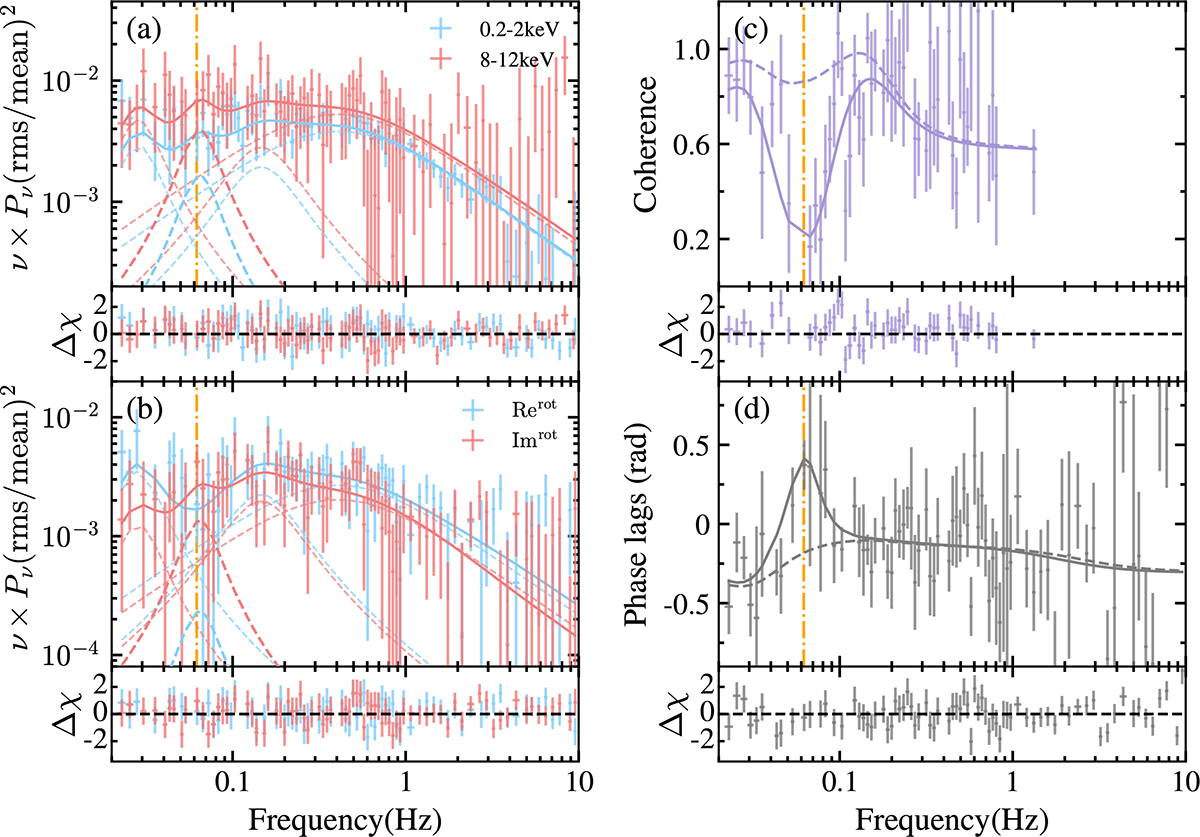
Joint fit to the NICER data of 1A 0535+262 from Day 1. (a) PS of the reference (0.2–2 keV; blue) and subject (8–12 keV; red) bands. (b) 45°-rotated CS: Rerot (blue) and Imrot (red; QPO Rerot sign-flipped; see Fig. A.2a). In (a) and (b), solid and dashed curves show the total five-Lorentzian model and individual components. (c) Coherence and (d) phase lags, with models including (solid) and excluding (dashed) the QPO. Dash-dotted yellow line marks the QPO centroid frequency, which coincides with a coherence dip and phase-lag rise. Data above ∼1 Hz are logarithmically re-binned with a factor of exp(1/10). Bottom sub-panels: Residuals, Δχ = (data − model)/error.
Current usage metrics show cumulative count of Article Views (full-text article views including HTML views, PDF and ePub downloads, according to the available data) and Abstracts Views on Vision4Press platform.
Data correspond to usage on the plateform after 2015. The current usage metrics is available 48-96 hours after online publication and is updated daily on week days.
Initial download of the metrics may take a while.