


Fig. 1.
Download original image
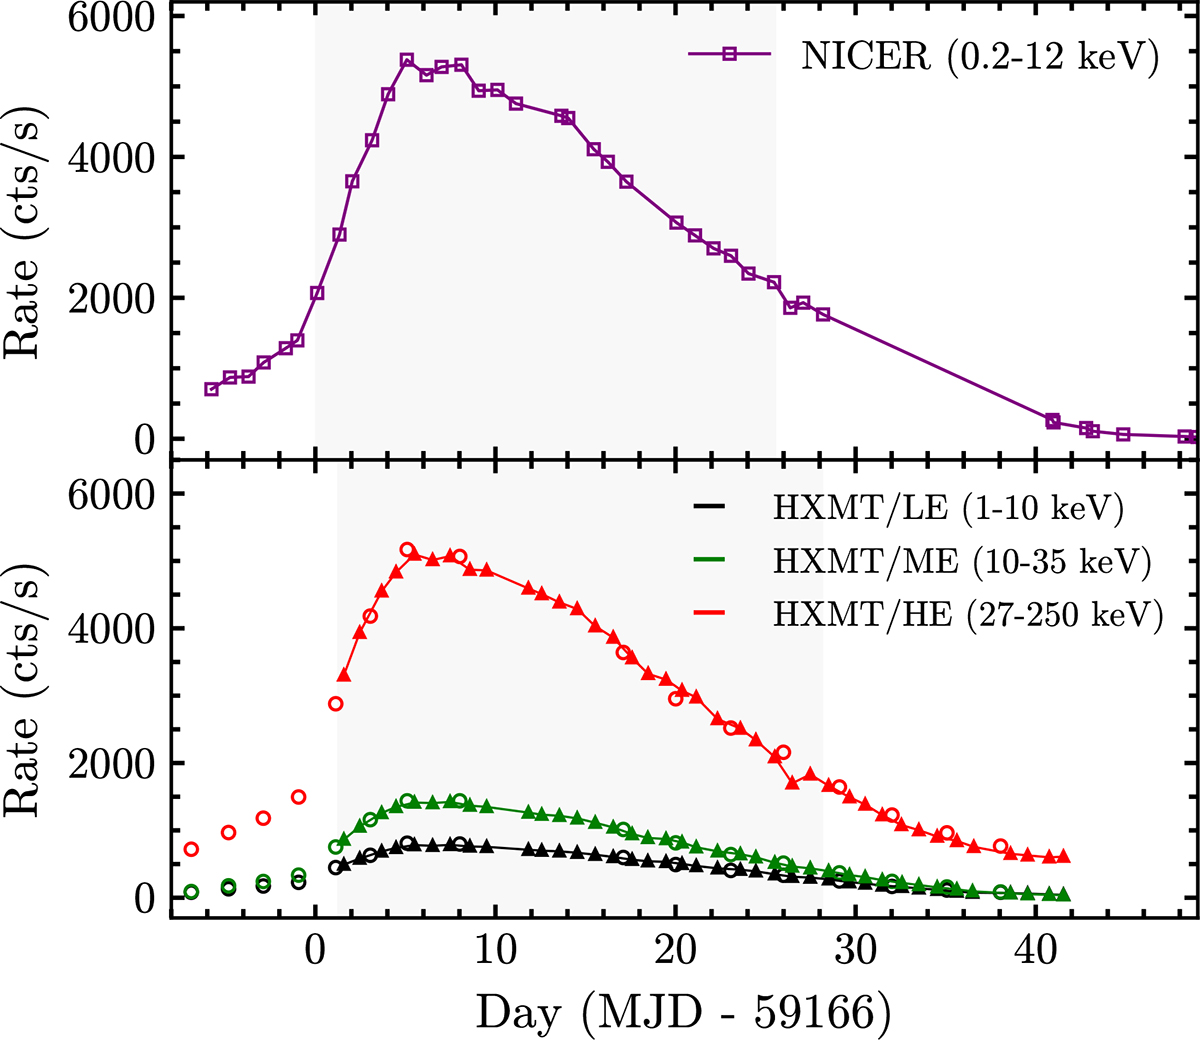
Long-term X-ray light curves of the 2020 outburst of 1A 0535+262. Top panel: NICER count rate in the 0.2–12 keV band. Each observation is represented by a purple square. Bottom panel: HXMT light curves from the Core Science Program (P0314316). The LE (1–10 keV), ME (10–35 keV), and HE (27–250 keV) count rates are represented by the black (bottom), green (middle), and red (top) triangles, respectively. Additional observations from proposal P0304099 (PI: P. Reig) are marked with circles. Each data point represents a single observational epoch. The shaded grey region denotes the interval during which the millihertz QPO was most significantly detected at energies above 27 keV (Ma et al. 2022) and selected for cross-spectral analysis.
Current usage metrics show cumulative count of Article Views (full-text article views including HTML views, PDF and ePub downloads, according to the available data) and Abstracts Views on Vision4Press platform.
Data correspond to usage on the plateform after 2015. The current usage metrics is available 48-96 hours after online publication and is updated daily on week days.
Initial download of the metrics may take a while.