Open Access
Fig. 7
Download original image
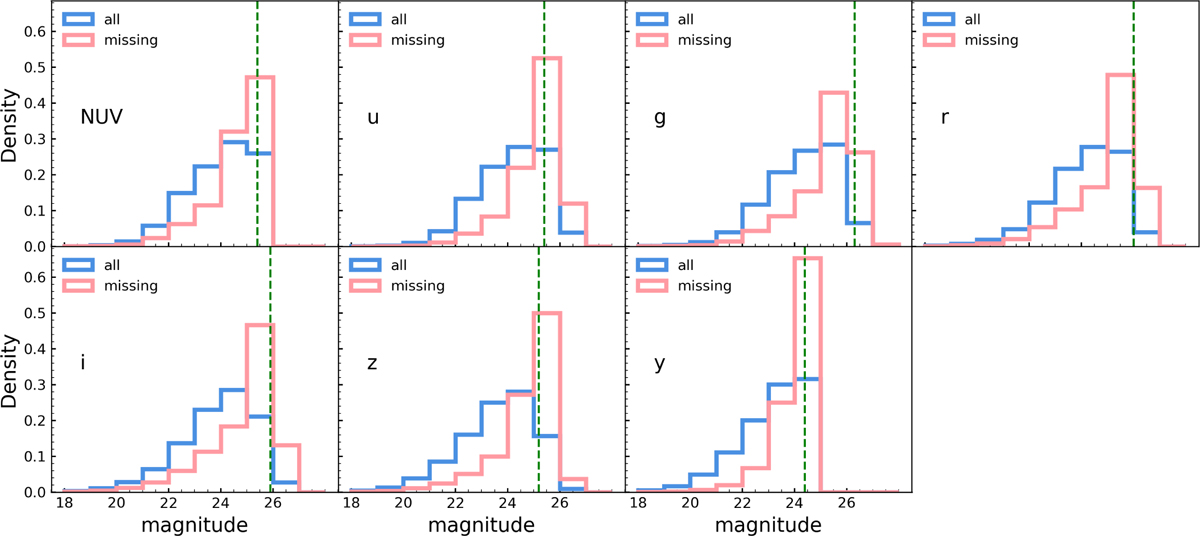
Magnitude distributions of the total source population (blue) and sources with missing data in the output catalog despite being present in the input catalog (pink).The dashed green line shows the magnitude limit of the corresponding CSST band.
Current usage metrics show cumulative count of Article Views (full-text article views including HTML views, PDF and ePub downloads, according to the available data) and Abstracts Views on Vision4Press platform.
Data correspond to usage on the plateform after 2015. The current usage metrics is available 48-96 hours after online publication and is updated daily on week days.
Initial download of the metrics may take a while.