Open Access
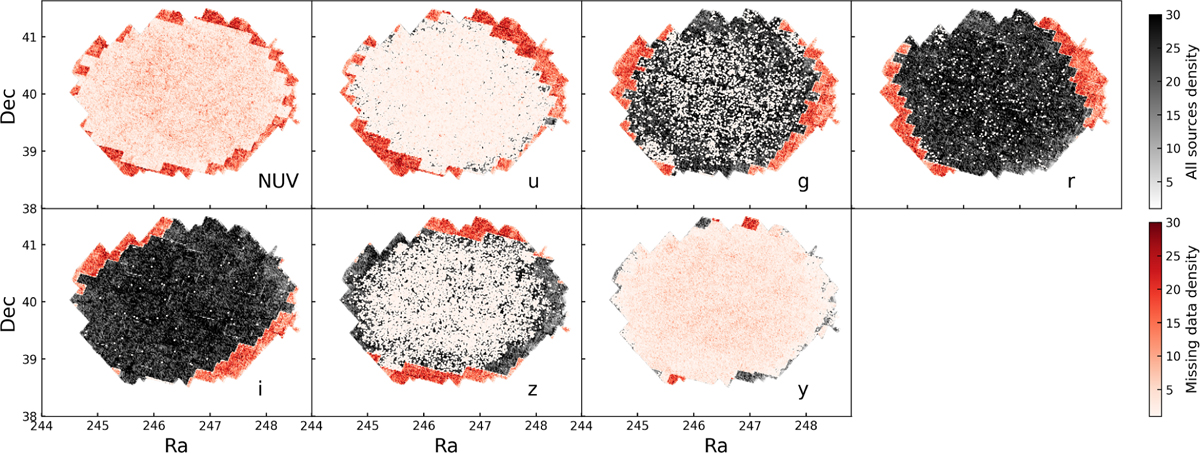
Fig. 6
Download original image
Spatial distribution of missing data for each photometric band in the input catalog. Gray points show all sources, while red points indicate sources with missing data in each band. A higher density of red points corresponds to a higher fraction of missing data.
Current usage metrics show cumulative count of Article Views (full-text article views including HTML views, PDF and ePub downloads, according to the available data) and Abstracts Views on Vision4Press platform.
Data correspond to usage on the plateform after 2015. The current usage metrics is available 48-96 hours after online publication and is updated daily on week days.
Initial download of the metrics may take a while.