Fig. 8.
Download original image
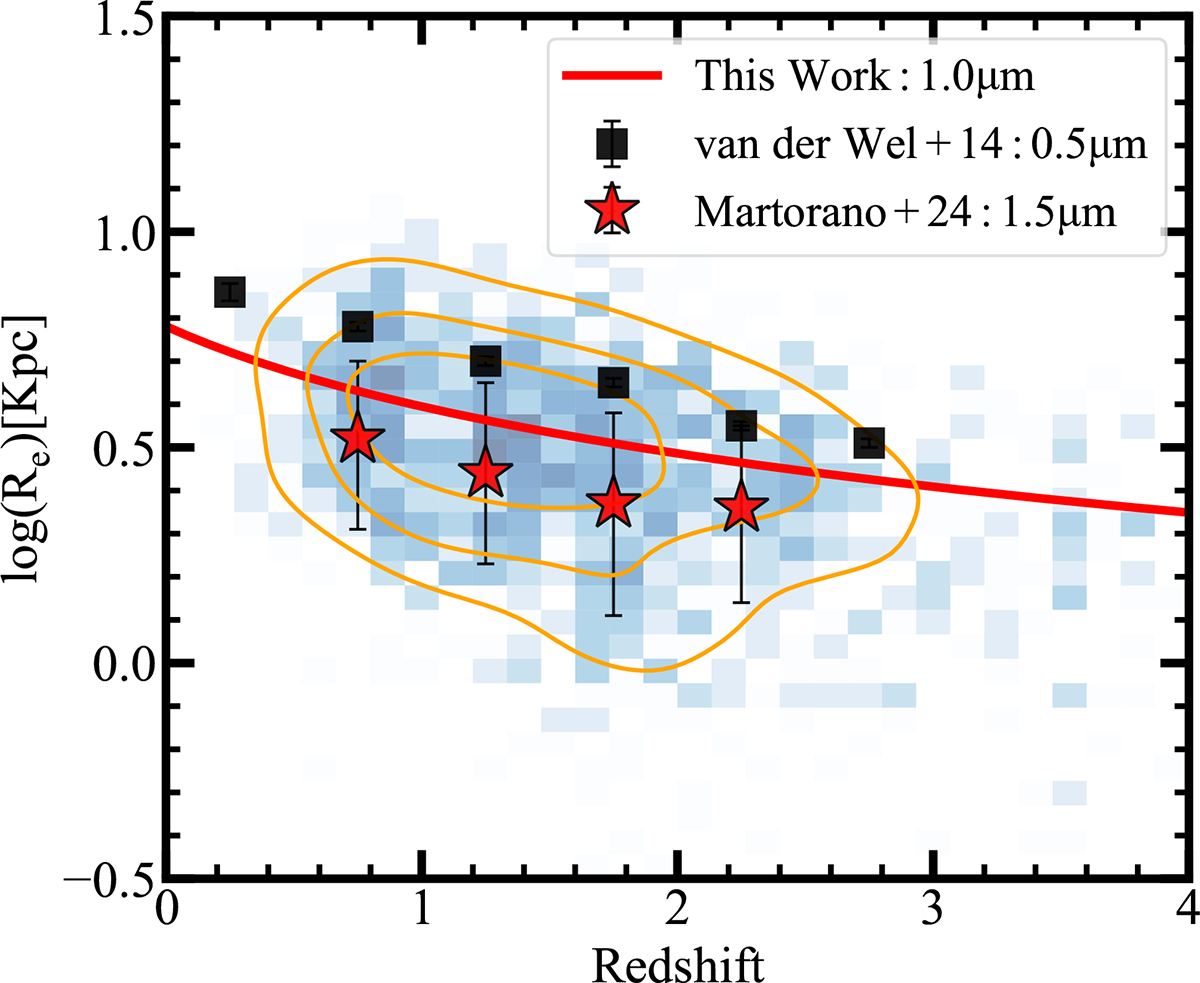
Two-dimensional histogram (blue) of the galaxy distribution with stellar mass ∼5 × 10¹⁰ M⊙. The orange contours enclose 25%, 50%, and 75% of the sample. The solid red line indicates the best-fitting relation derived in Section 4.2. To facilitate comparison with previous studies, the results from van der van der Wel et al. (2014), derived from rest-frame 0.5 μm sizes, are shown as black squares, and those from Martorano et al. (2024), derived from rest-frame 1.5 μm sizes, are shown as red stars.
Current usage metrics show cumulative count of Article Views (full-text article views including HTML views, PDF and ePub downloads, according to the available data) and Abstracts Views on Vision4Press platform.
Data correspond to usage on the plateform after 2015. The current usage metrics is available 48-96 hours after online publication and is updated daily on week days.
Initial download of the metrics may take a while.