Open Access
Fig. 7.
Download original image
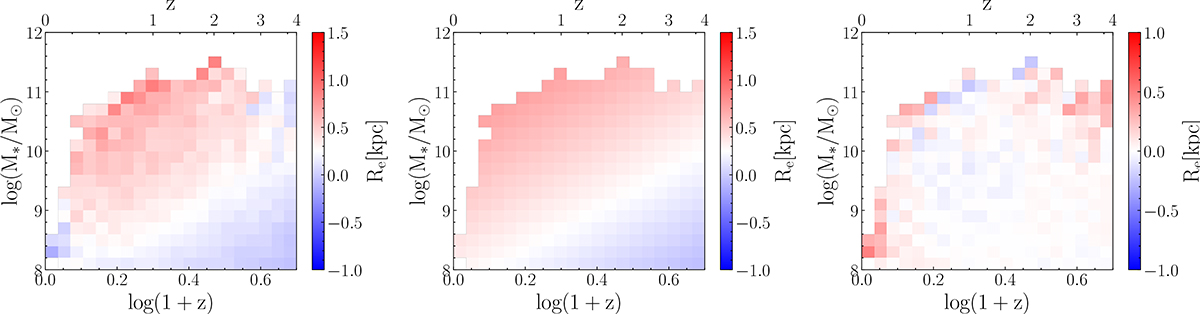
Left panel: Distribution of size for SFGs mapped onto the stellar mass vs. redshift plane, where the color scale indicates the median size within each square bin. Middle panel: Best-fit models of the size mass relation. Right panel: Residuals between the observed size mass relation and the best-fit model.
Current usage metrics show cumulative count of Article Views (full-text article views including HTML views, PDF and ePub downloads, according to the available data) and Abstracts Views on Vision4Press platform.
Data correspond to usage on the plateform after 2015. The current usage metrics is available 48-96 hours after online publication and is updated daily on week days.
Initial download of the metrics may take a while.