Fig. 6.
Download original image
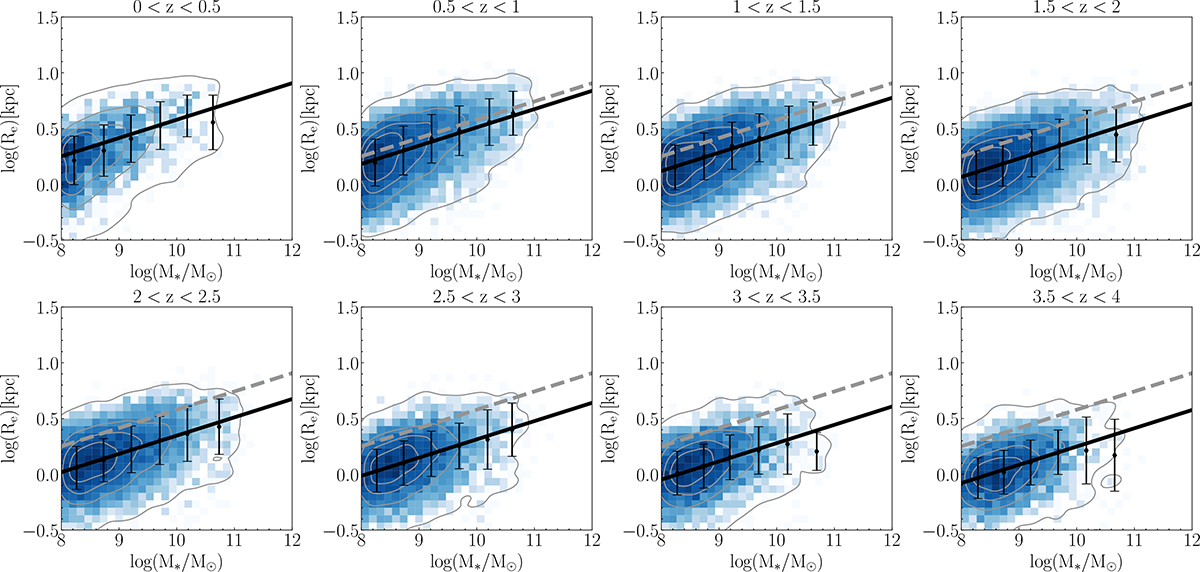
Distribution of galaxy sizes as a function of stellar mass for SFGs across different redshift bins. In each panel, the gray contours enclose 25%, 50%, 75%, and 99% of the sample. The black points with error bars denote the median effective radius and the corresponding standard deviation within stellar mass bins. The solid black line represents the best-fit size–mass relation derived from our analysis. For comparison, we show the results for the 0 < z < 0.5 bin as dashed gray lines in the remaining panels.
Current usage metrics show cumulative count of Article Views (full-text article views including HTML views, PDF and ePub downloads, according to the available data) and Abstracts Views on Vision4Press platform.
Data correspond to usage on the plateform after 2015. The current usage metrics is available 48-96 hours after online publication and is updated daily on week days.
Initial download of the metrics may take a while.