Fig. 5.
Download original image
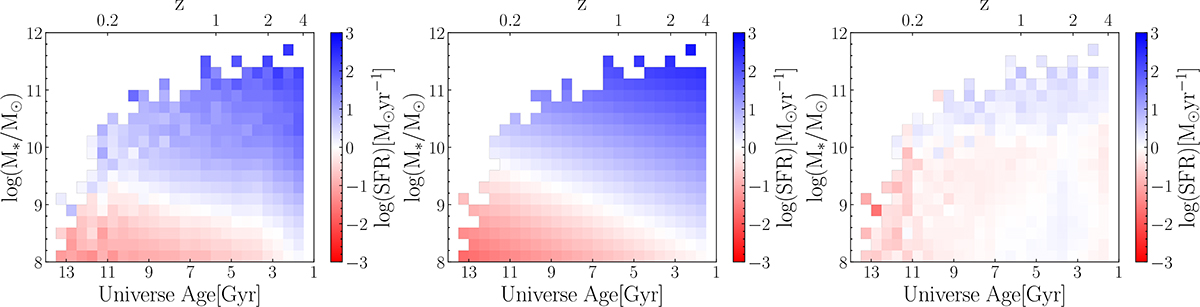
Left panel: Distribution of SFR for SFGs mapped onto the stellar mass vs. Universe age plane, where the color scale indicates the median SFR within each square bin. Middle panel: Best-fit SFMS derived using a linear relation. Right panel: Residuals between the observed SFRs and the best-fit linear model. The small residuals demonstrate that a linear relation provides a good representation of the SFMS for our sample across the explored stellar mass and cosmic time ranges.
Current usage metrics show cumulative count of Article Views (full-text article views including HTML views, PDF and ePub downloads, according to the available data) and Abstracts Views on Vision4Press platform.
Data correspond to usage on the plateform after 2015. The current usage metrics is available 48-96 hours after online publication and is updated daily on week days.
Initial download of the metrics may take a while.