Fig. 4.
Download original image
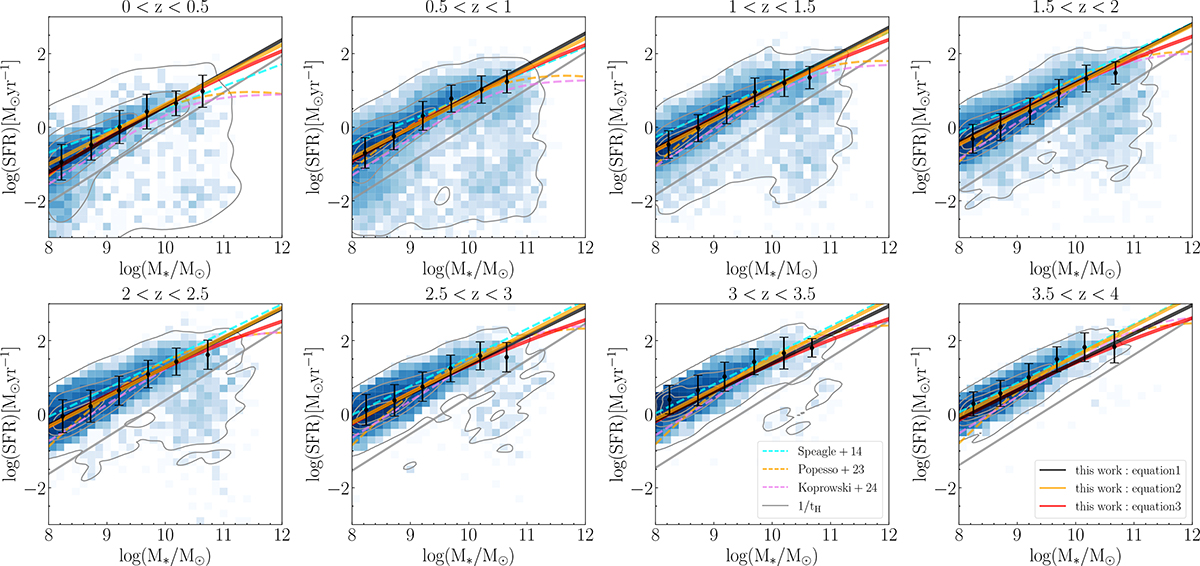
Distribution of galaxy SFR as a function of stellar mass across different redshift bins. Each panel corresponds to a different redshift interval. The gray contours enclose 25%, 50%, 75%, and 99% of the galaxy population, respectively. The solid gray line in each panel indicates the sSFR threshold of 1/tH, where tH is the Hubble time at the median redshift of the bin; galaxies above this threshold are classified as SFGs. The black points with error bars represent the median SFR and the corresponding scatter for SFGs in different stellar mass bins. The solid black line shows the best-fit SFMS assuming the formulation in Equation (1), while the solid orange and red lines corresponds to the best-fit results derived from Equations (2) and (3), respectively. For comparison, we include results from previous studies: the dashed cyan line denotes the SFMS from Speagle et al. (2014), and the dashed orange and violet lines represent results from Popesso et al. (2023) and Koprowski et al. (2024), respectively.
Current usage metrics show cumulative count of Article Views (full-text article views including HTML views, PDF and ePub downloads, according to the available data) and Abstracts Views on Vision4Press platform.
Data correspond to usage on the plateform after 2015. The current usage metrics is available 48-96 hours after online publication and is updated daily on week days.
Initial download of the metrics may take a while.