Fig. A.1.
Download original image
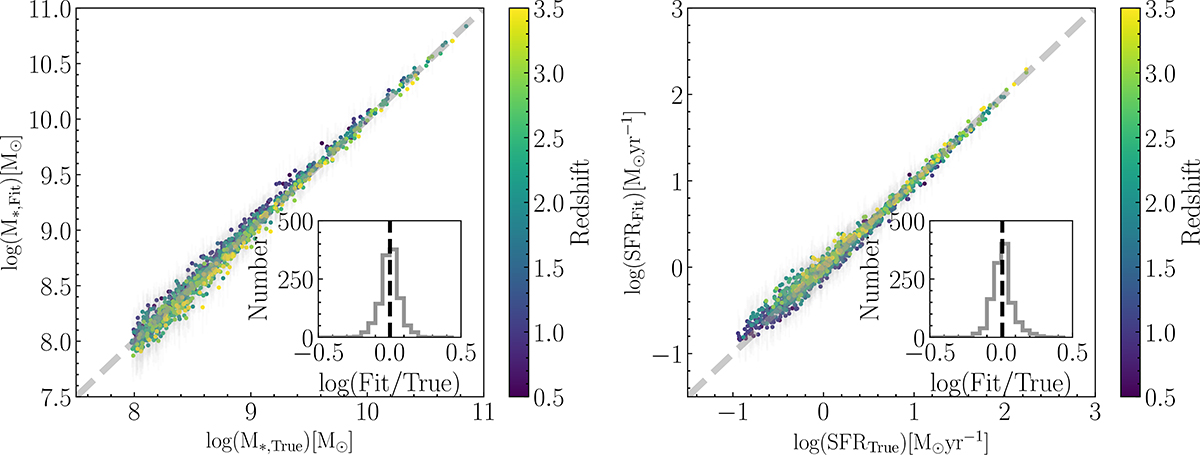
Comparison between the best-fit parameters derived from SED-fitting tests using mock SEDs and the corresponding input (ground truth) values. Data points are color-coded by redshift. The light gray error bars represent the uncertainties from the SED fitting process. The left panel shows results for stellar mass, while the right panel displays results for SFR. Insets in each panel present histograms of the logarithmic differences between the recovered and input values, with black dashed lines indicating the median offsets.
Current usage metrics show cumulative count of Article Views (full-text article views including HTML views, PDF and ePub downloads, according to the available data) and Abstracts Views on Vision4Press platform.
Data correspond to usage on the plateform after 2015. The current usage metrics is available 48-96 hours after online publication and is updated daily on week days.
Initial download of the metrics may take a while.