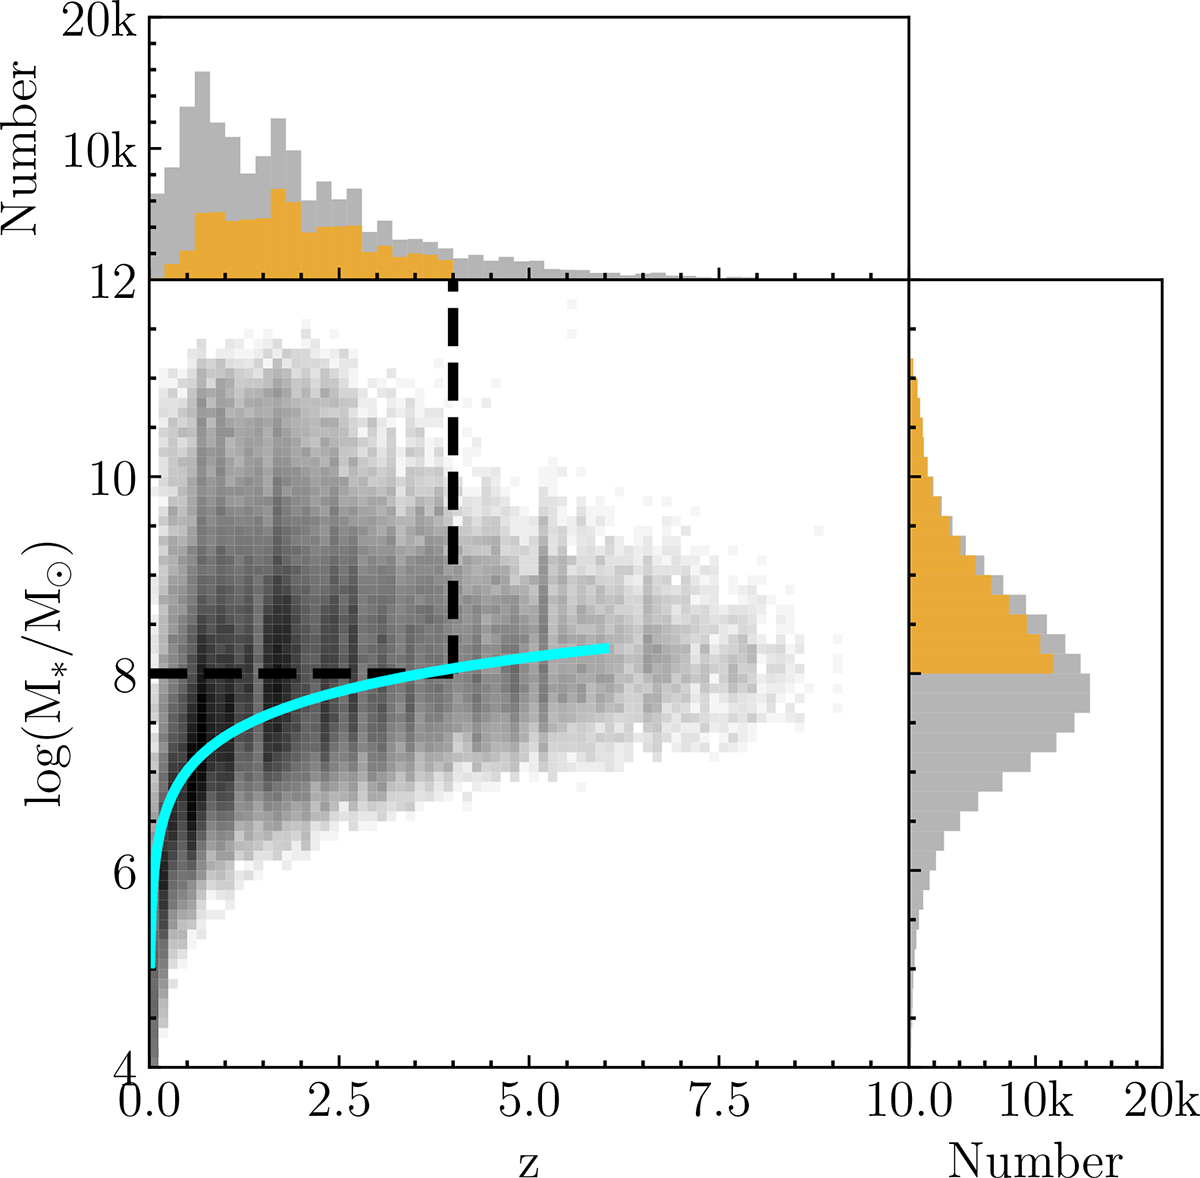
Fig. 1.
Download original image
Redshift and stellar mass distribution of our total good sample. The region enclosed by the dashed black lines indicates the selected sample we used, defined by 0 < z < 4 and log(M*/M⊙) > 8. The solid cyan curve represents the 90% stellar mass completeness limit, which corresponds to a magnitude limit of F444Wlim = 28 mag. The gray (yellow) histograms in the top and right panels show the redshift and stellar mass distributions of the good sample (selected sample), respectively.
Current usage metrics show cumulative count of Article Views (full-text article views including HTML views, PDF and ePub downloads, according to the available data) and Abstracts Views on Vision4Press platform.
Data correspond to usage on the plateform after 2015. The current usage metrics is available 48-96 hours after online publication and is updated daily on week days.
Initial download of the metrics may take a while.