


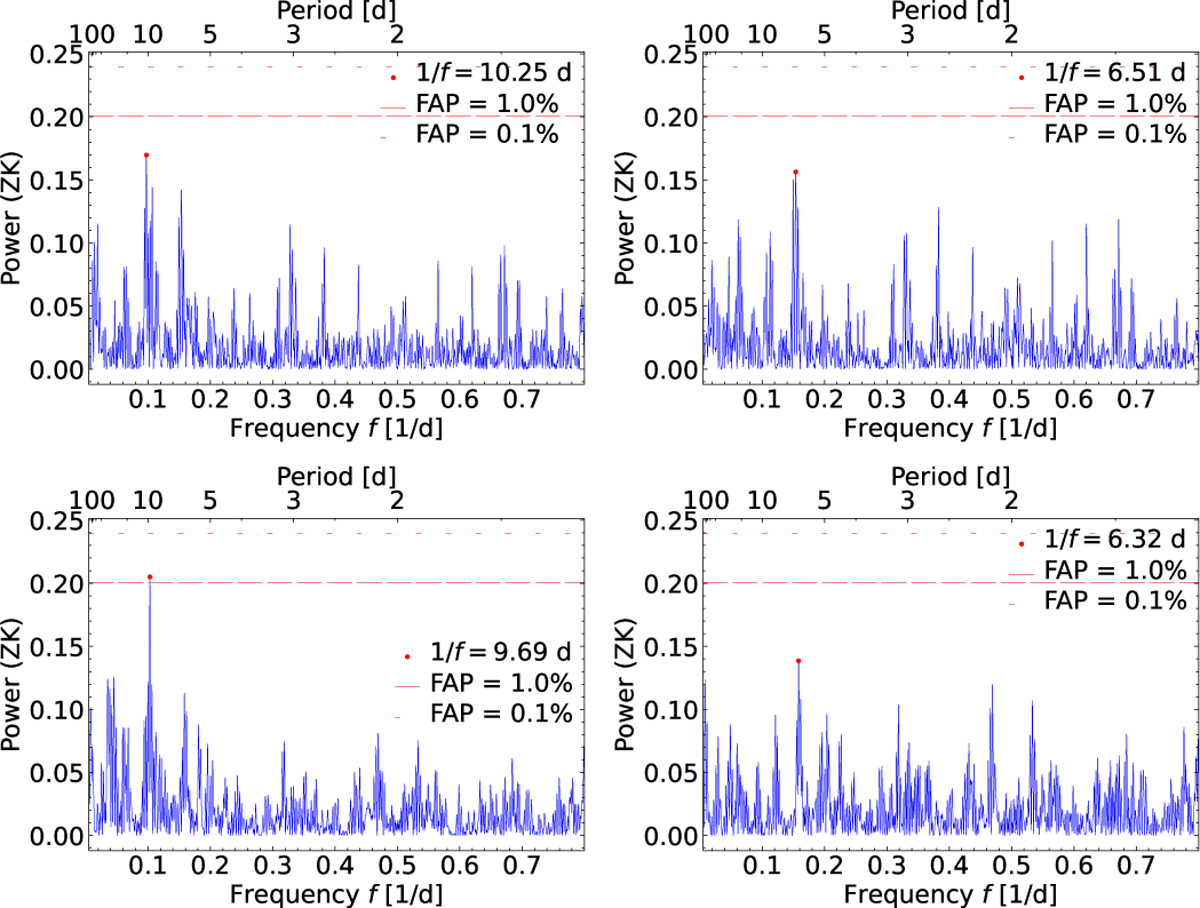
Fig. B.5
Download original image
GLS periodograms of the FHWM (first row) and γ (second row) as computed from the HARPS-N time series after a pre-whitening. Although not always significant, we systematically observe peaks at ∼10d (first column) and ∼6.4d (second column), which we ascribe to the first (Prot,*/2) and second (Prot,*/3) harmonics of the stellar rotation period (Prot,*). A similar behaviour is seen in the other RV-related activity indicators (not shown here).
Current usage metrics show cumulative count of Article Views (full-text article views including HTML views, PDF and ePub downloads, according to the available data) and Abstracts Views on Vision4Press platform.
Data correspond to usage on the plateform after 2015. The current usage metrics is available 48-96 hours after online publication and is updated daily on week days.
Initial download of the metrics may take a while.