


Fig. B.4
Download original image
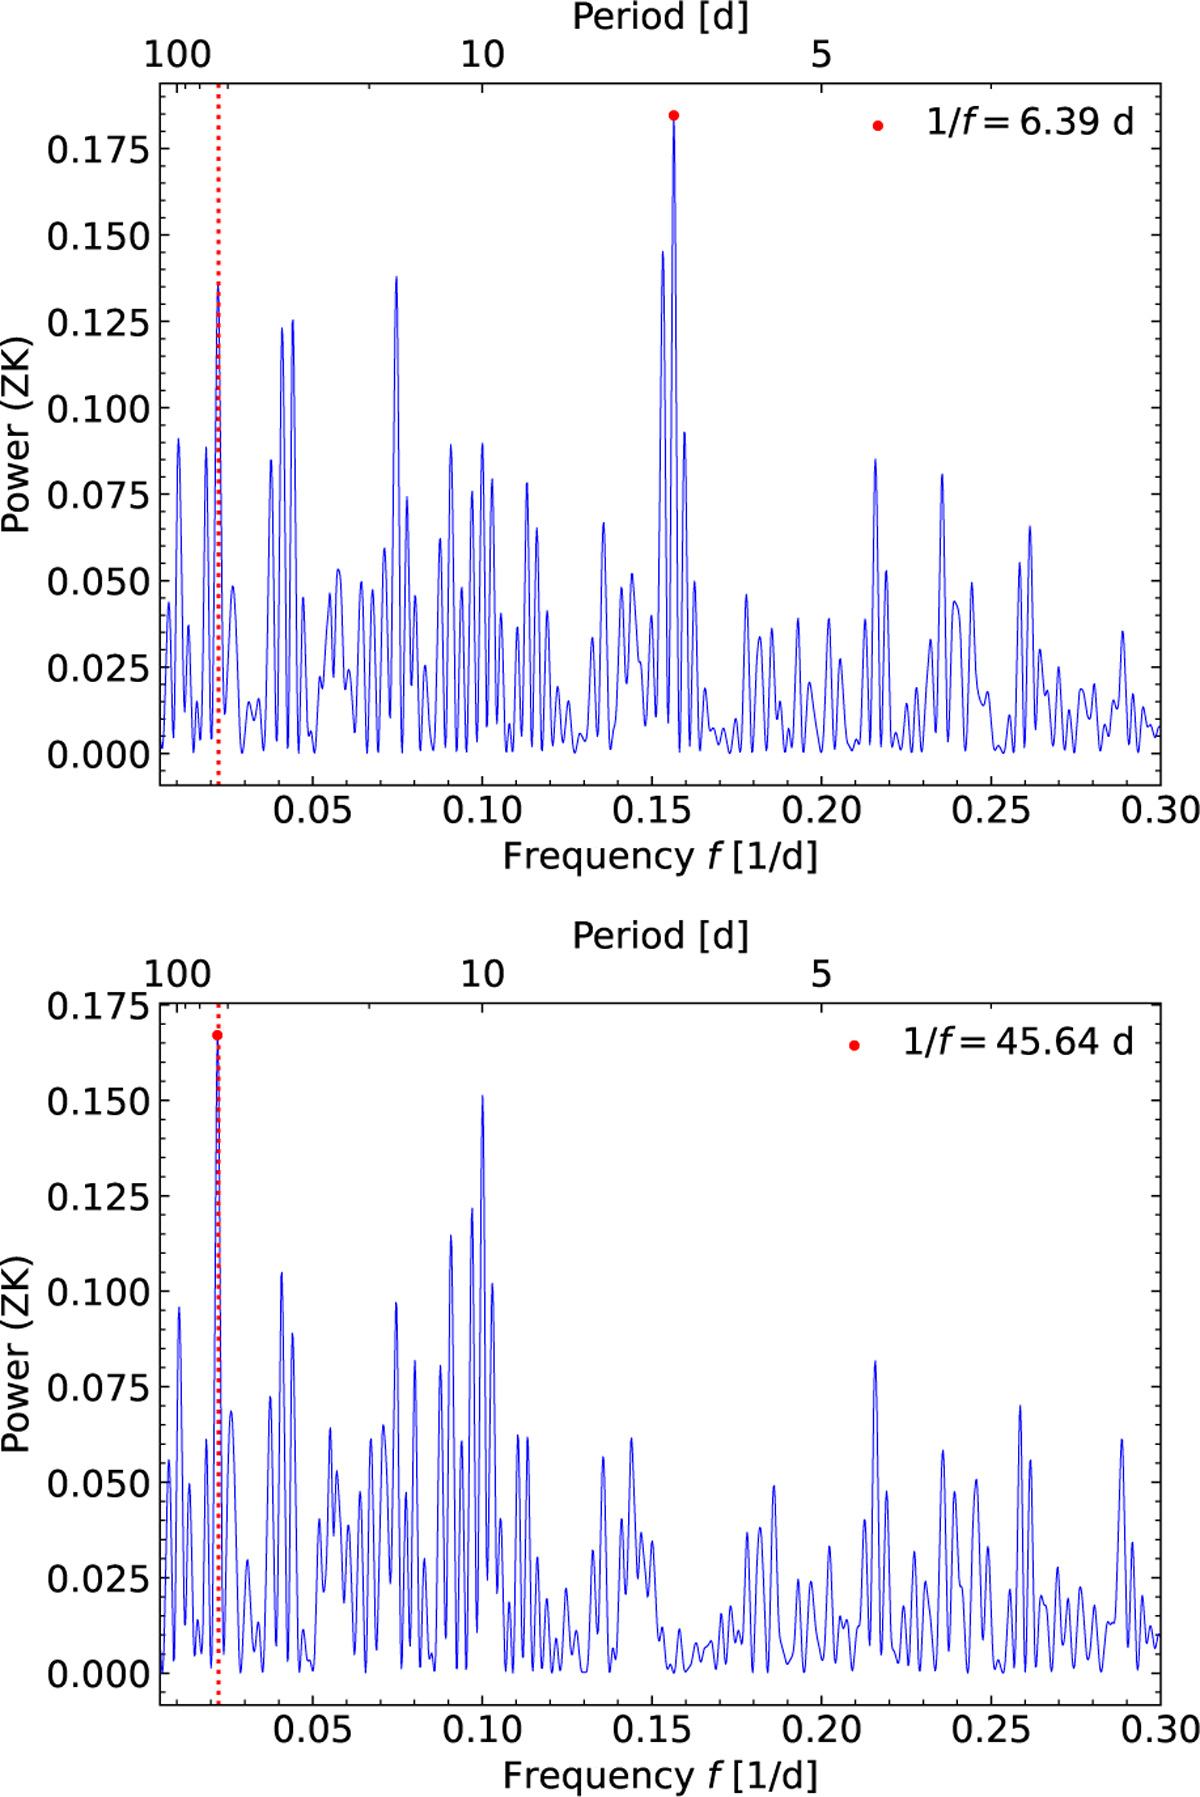
Top. GLS periodogram of the RV residuals obtained after subtracting the Keplerian signals of the four transiting planets to the HARPS-N detrended RV time series (Sect. 5.3). The most prominent peak is the second harmonic of Prot,*. The vertical dotted red line marks the signal of TOI-5624 f at ∼ 45 d. Bottom. Same but after further subtracting the signal at ∼ 6.4 d. The signal at ~45 d becomes the most prominent one with the second highest peak being Prot,*/2.
Current usage metrics show cumulative count of Article Views (full-text article views including HTML views, PDF and ePub downloads, according to the available data) and Abstracts Views on Vision4Press platform.
Data correspond to usage on the plateform after 2015. The current usage metrics is available 48-96 hours after online publication and is updated daily on week days.
Initial download of the metrics may take a while.