


Fig. B.3
Download original image
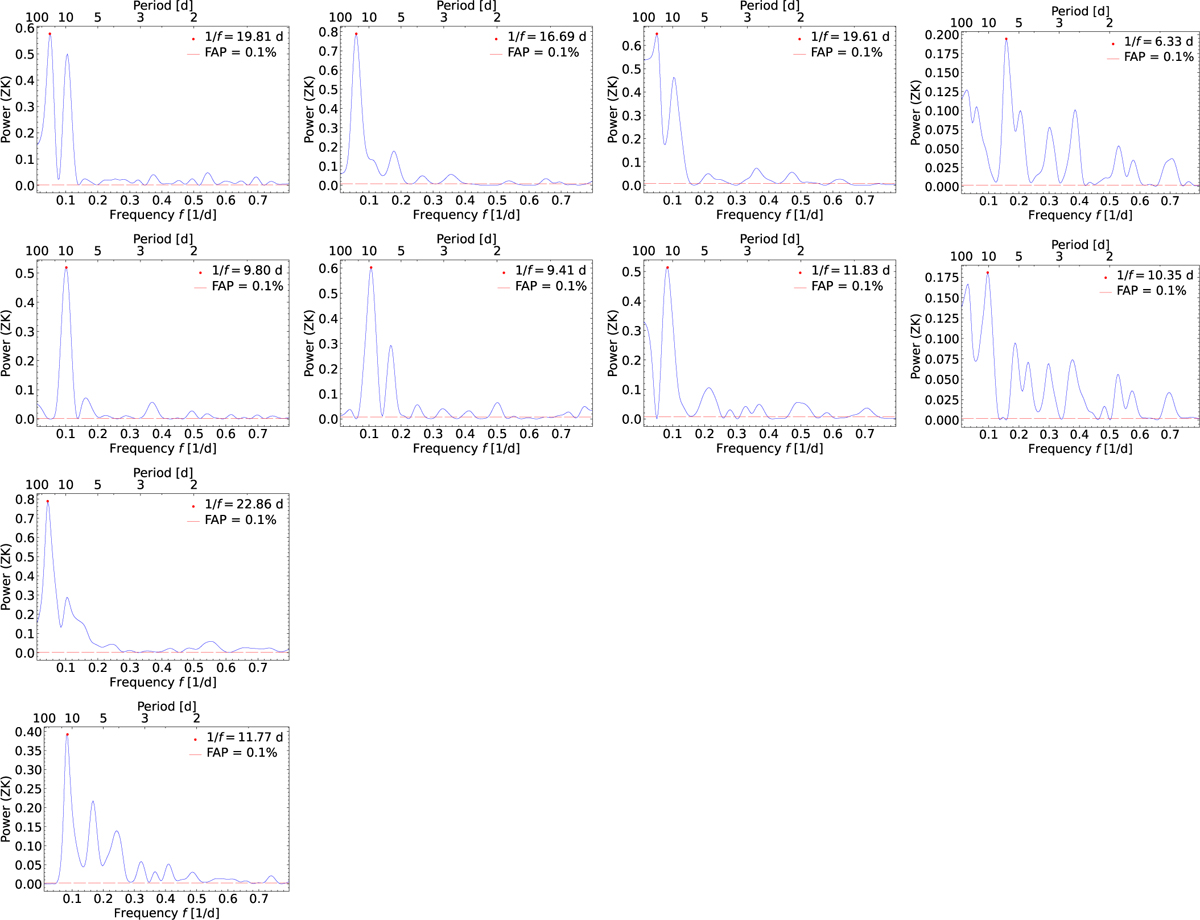
GLS periodograms of the five TESS sectors (SAP photometry) computed after removing all the transit windows. First row: from left to right sector 22, 48, 49, and 75. Second row: same as first row, but after subtracting the most prominent peak. Third row: sector 76. Fourth row: sector 76 after subtracting the most prominent peak. The most prominent peak is always at Prot,* ∼ 20 days, except for Sector 75 (last panels in the first and second row) where the second (Prot,*/3) and first (Prot,*/2) harmonic of Prot,* appear.
Current usage metrics show cumulative count of Article Views (full-text article views including HTML views, PDF and ePub downloads, according to the available data) and Abstracts Views on Vision4Press platform.
Data correspond to usage on the plateform after 2015. The current usage metrics is available 48-96 hours after online publication and is updated daily on week days.
Initial download of the metrics may take a while.