


Fig. B.2
Download original image
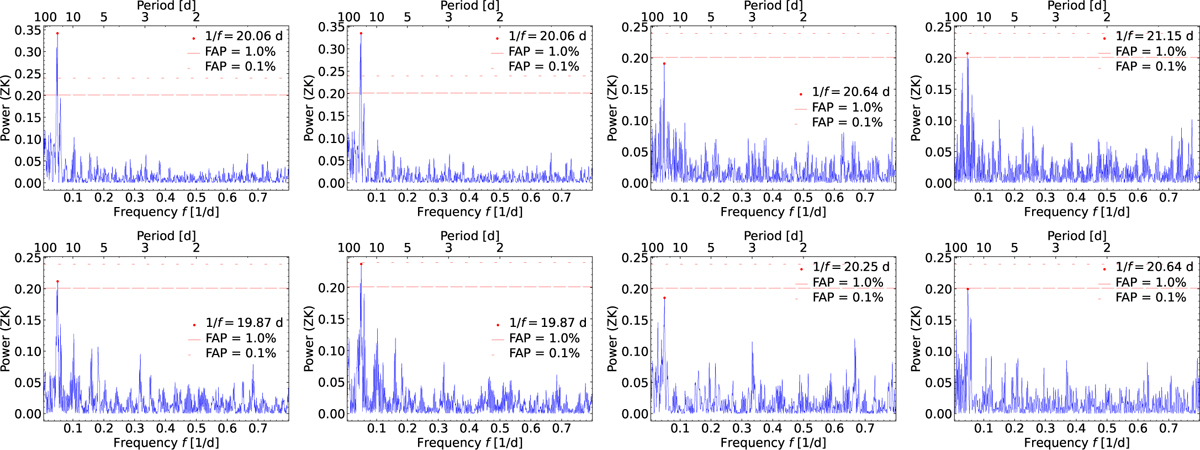
GLS periodograms of different activity indicators as inferred from the HARPS-N RV time series with the FAP levels at 1% and 0.1% marked as dashed and dotted red lines, respectively. First row: from left to right FWHM, FWHMSN, A, and ASN. Second row: from left to right BIS, γ, log R′HK, and Hα, where the latter two were subject to a pre-whitening. The most prominent peak is always at ∼20 days, which is likely the stellar rotation period (Prot,*).
Current usage metrics show cumulative count of Article Views (full-text article views including HTML views, PDF and ePub downloads, according to the available data) and Abstracts Views on Vision4Press platform.
Data correspond to usage on the plateform after 2015. The current usage metrics is available 48-96 hours after online publication and is updated daily on week days.
Initial download of the metrics may take a while.