


Fig. 3
Download original image
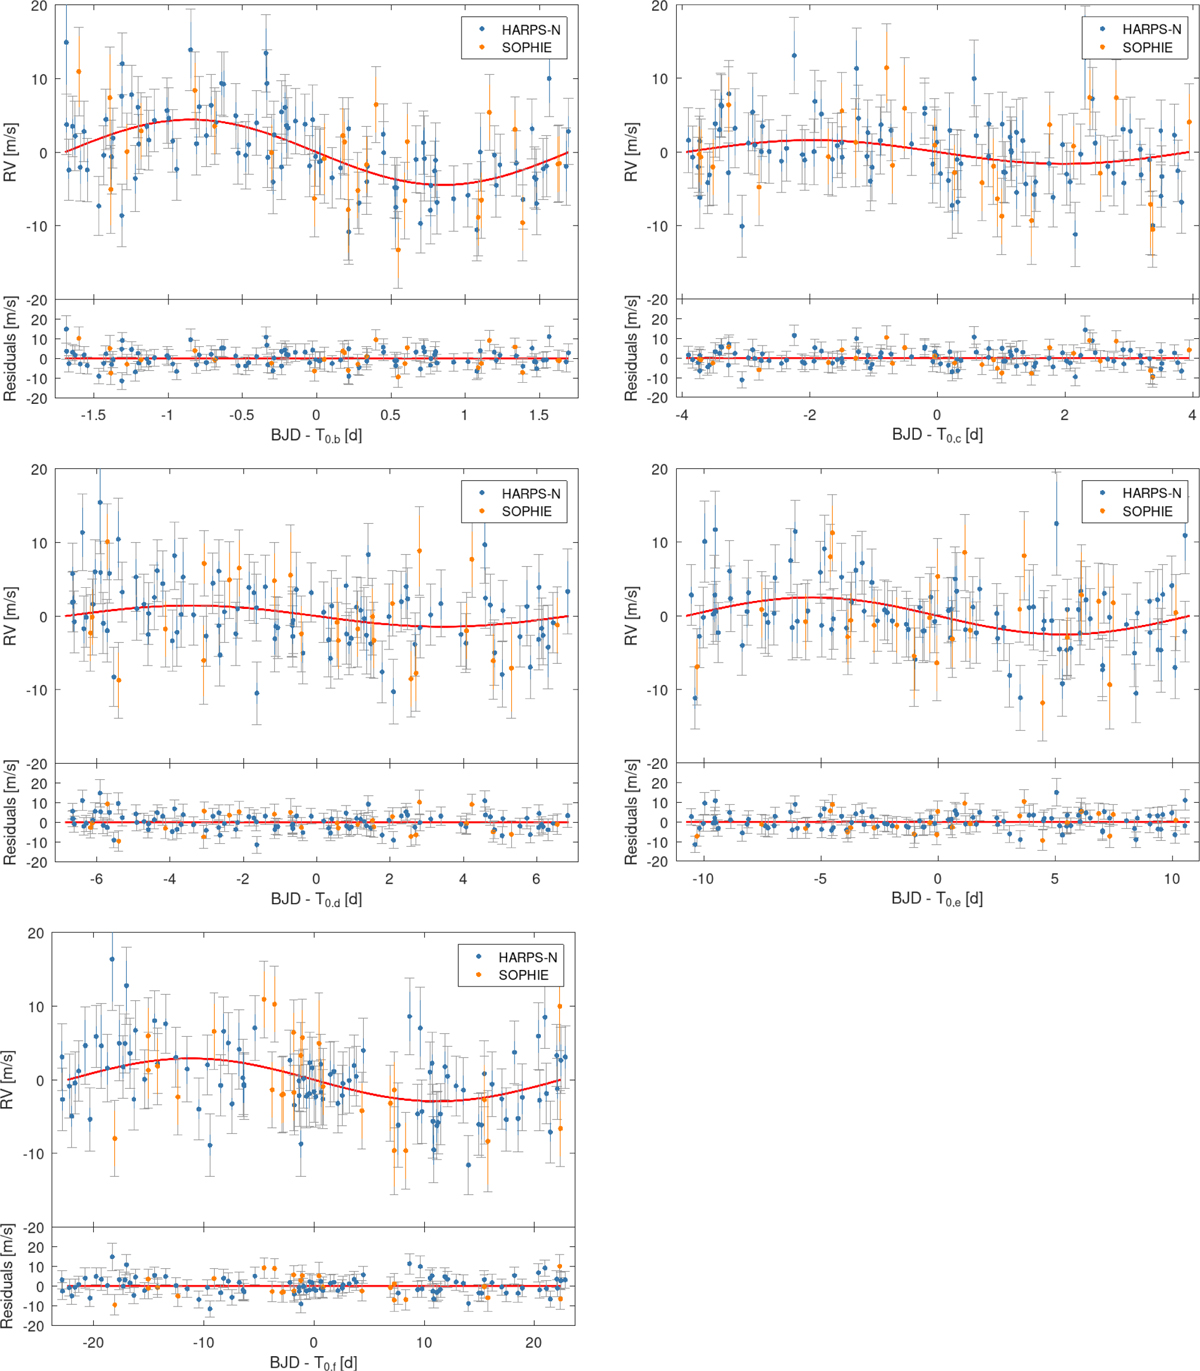
Detrended RV time series folded according to the period of TOI-5624b (top-left), TOI-5624c (top-right), TOI-5624d (middleleft), TOI-5624e (middle-right), and TOI-5624f (bottom-left) after removing the Keplerian signals of the other planets as inferred from the MCMCI analysis. The marker colour distinguishes the two different instruments (light blue for HARPS-N and orange for SOPHIE), while the red line represents the inferred model. The jitter contribution in the error bars is highlighted in grey. The RV semi-amplitudes are measured at the 6.9, 2.5, 2.2, 3.1, and 3.5σ level for planets b, c, d, e, and f, respectively.
Current usage metrics show cumulative count of Article Views (full-text article views including HTML views, PDF and ePub downloads, according to the available data) and Abstracts Views on Vision4Press platform.
Data correspond to usage on the plateform after 2015. The current usage metrics is available 48-96 hours after online publication and is updated daily on week days.
Initial download of the metrics may take a while.