Fig. C.1.
Download original image
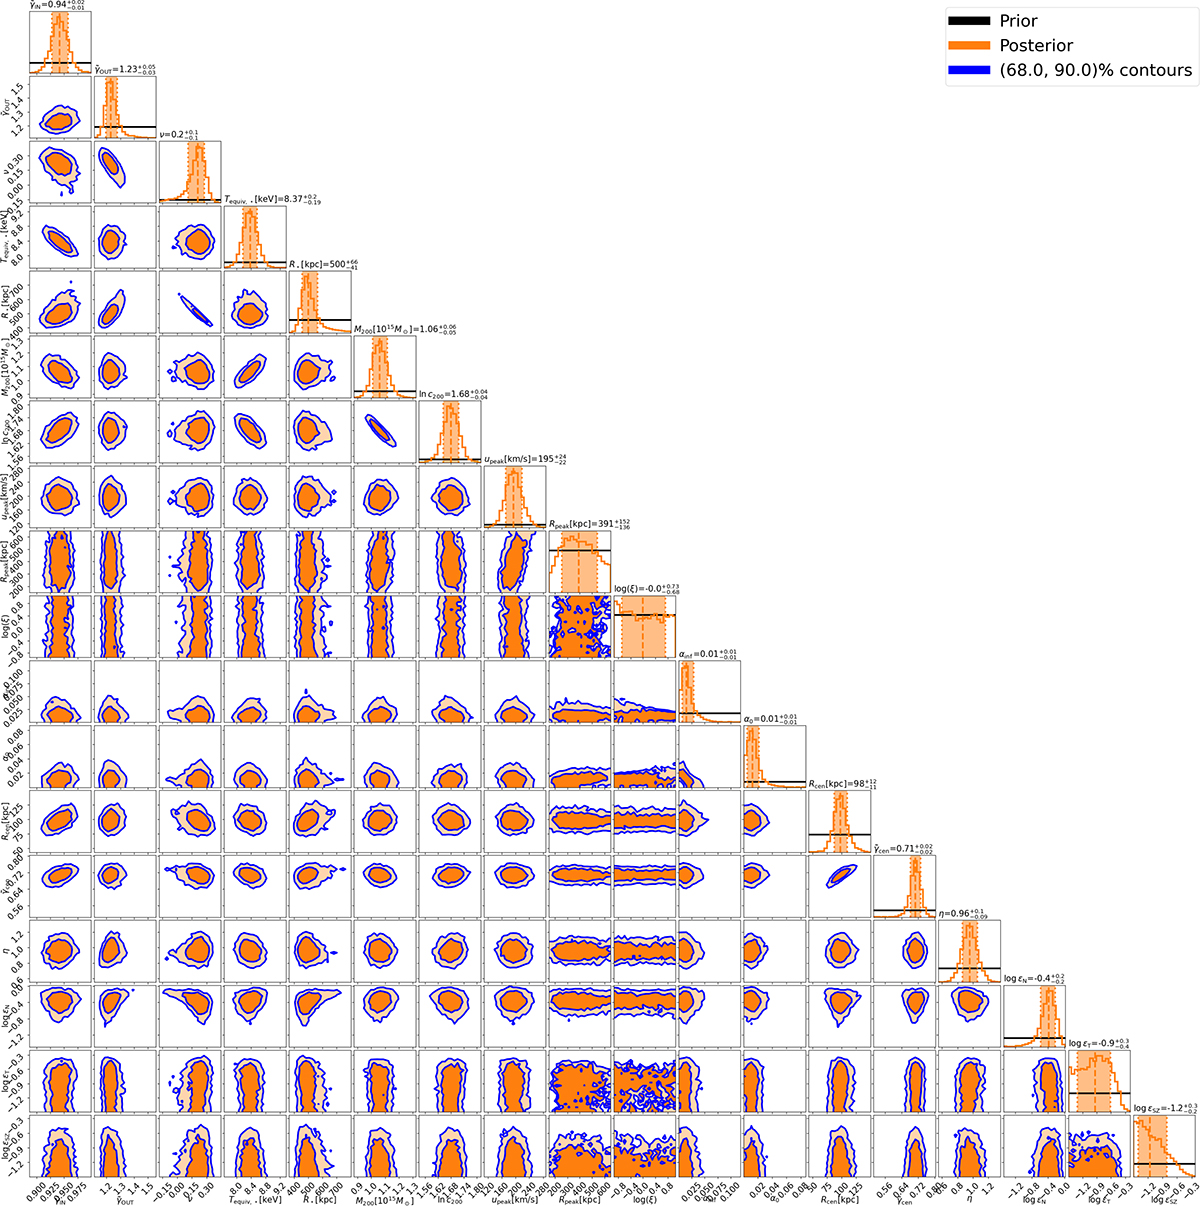
Marginal (diagonal panels) and two-parameters joint (off-diagonal panels) distributions of all the free parameters in the MCMC run (![]() ,
, ![]() , ν, Tequiv,★, R★, M200, lnc200, upeak, Rpeak, log ξ, αinf, α0, RCEN,
, ν, Tequiv,★, R★, M200, lnc200, upeak, Rpeak, log ξ, αinf, α0, RCEN, ![]() , η, log ϵN, log ϵT and log ϵSZ; see Sect. 4.1, for details). In each diagonal panel, the black curve and the orange histogram are the marginal prior and posterior, respectively; the light-orange vertical band is the 16th-84th percentile interval of the marginal posterior. In each off-diagonal panel, the dark-orange and light-orange regions, enclosed by the blue lines, define the 68% and 90% credible regions of the joint posteriors, respectively.
, η, log ϵN, log ϵT and log ϵSZ; see Sect. 4.1, for details). In each diagonal panel, the black curve and the orange histogram are the marginal prior and posterior, respectively; the light-orange vertical band is the 16th-84th percentile interval of the marginal posterior. In each off-diagonal panel, the dark-orange and light-orange regions, enclosed by the blue lines, define the 68% and 90% credible regions of the joint posteriors, respectively.
Current usage metrics show cumulative count of Article Views (full-text article views including HTML views, PDF and ePub downloads, according to the available data) and Abstracts Views on Vision4Press platform.
Data correspond to usage on the plateform after 2015. The current usage metrics is available 48-96 hours after online publication and is updated daily on week days.
Initial download of the metrics may take a while.