Fig. A.1.
Download original image
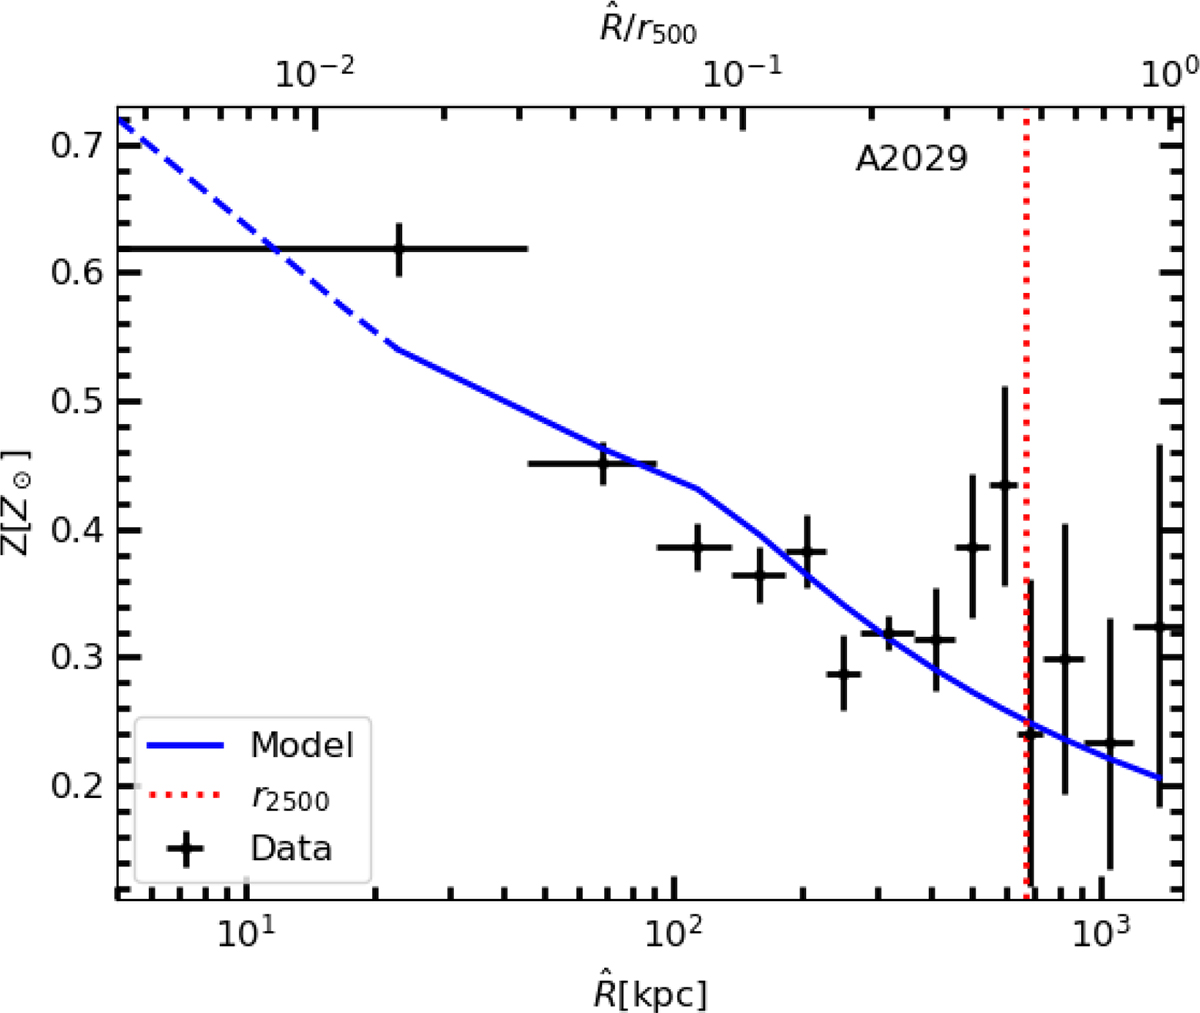
Model metallicity (blue line) as a function of the projected radius ![]() (the profile in the extrapolation range is dashed). The Ghirardini et al. (2019a) measurements are the black dots, with vertical and horizonthal error bars corresponding to the statistical uncertainties in the spectral analyses and to the extent of the radial bins. The XRISM/Resolve pointings extend from the center out to the vertical line.
(the profile in the extrapolation range is dashed). The Ghirardini et al. (2019a) measurements are the black dots, with vertical and horizonthal error bars corresponding to the statistical uncertainties in the spectral analyses and to the extent of the radial bins. The XRISM/Resolve pointings extend from the center out to the vertical line.
Current usage metrics show cumulative count of Article Views (full-text article views including HTML views, PDF and ePub downloads, according to the available data) and Abstracts Views on Vision4Press platform.
Data correspond to usage on the plateform after 2015. The current usage metrics is available 48-96 hours after online publication and is updated daily on week days.
Initial download of the metrics may take a while.