Fig. 3.
Download original image
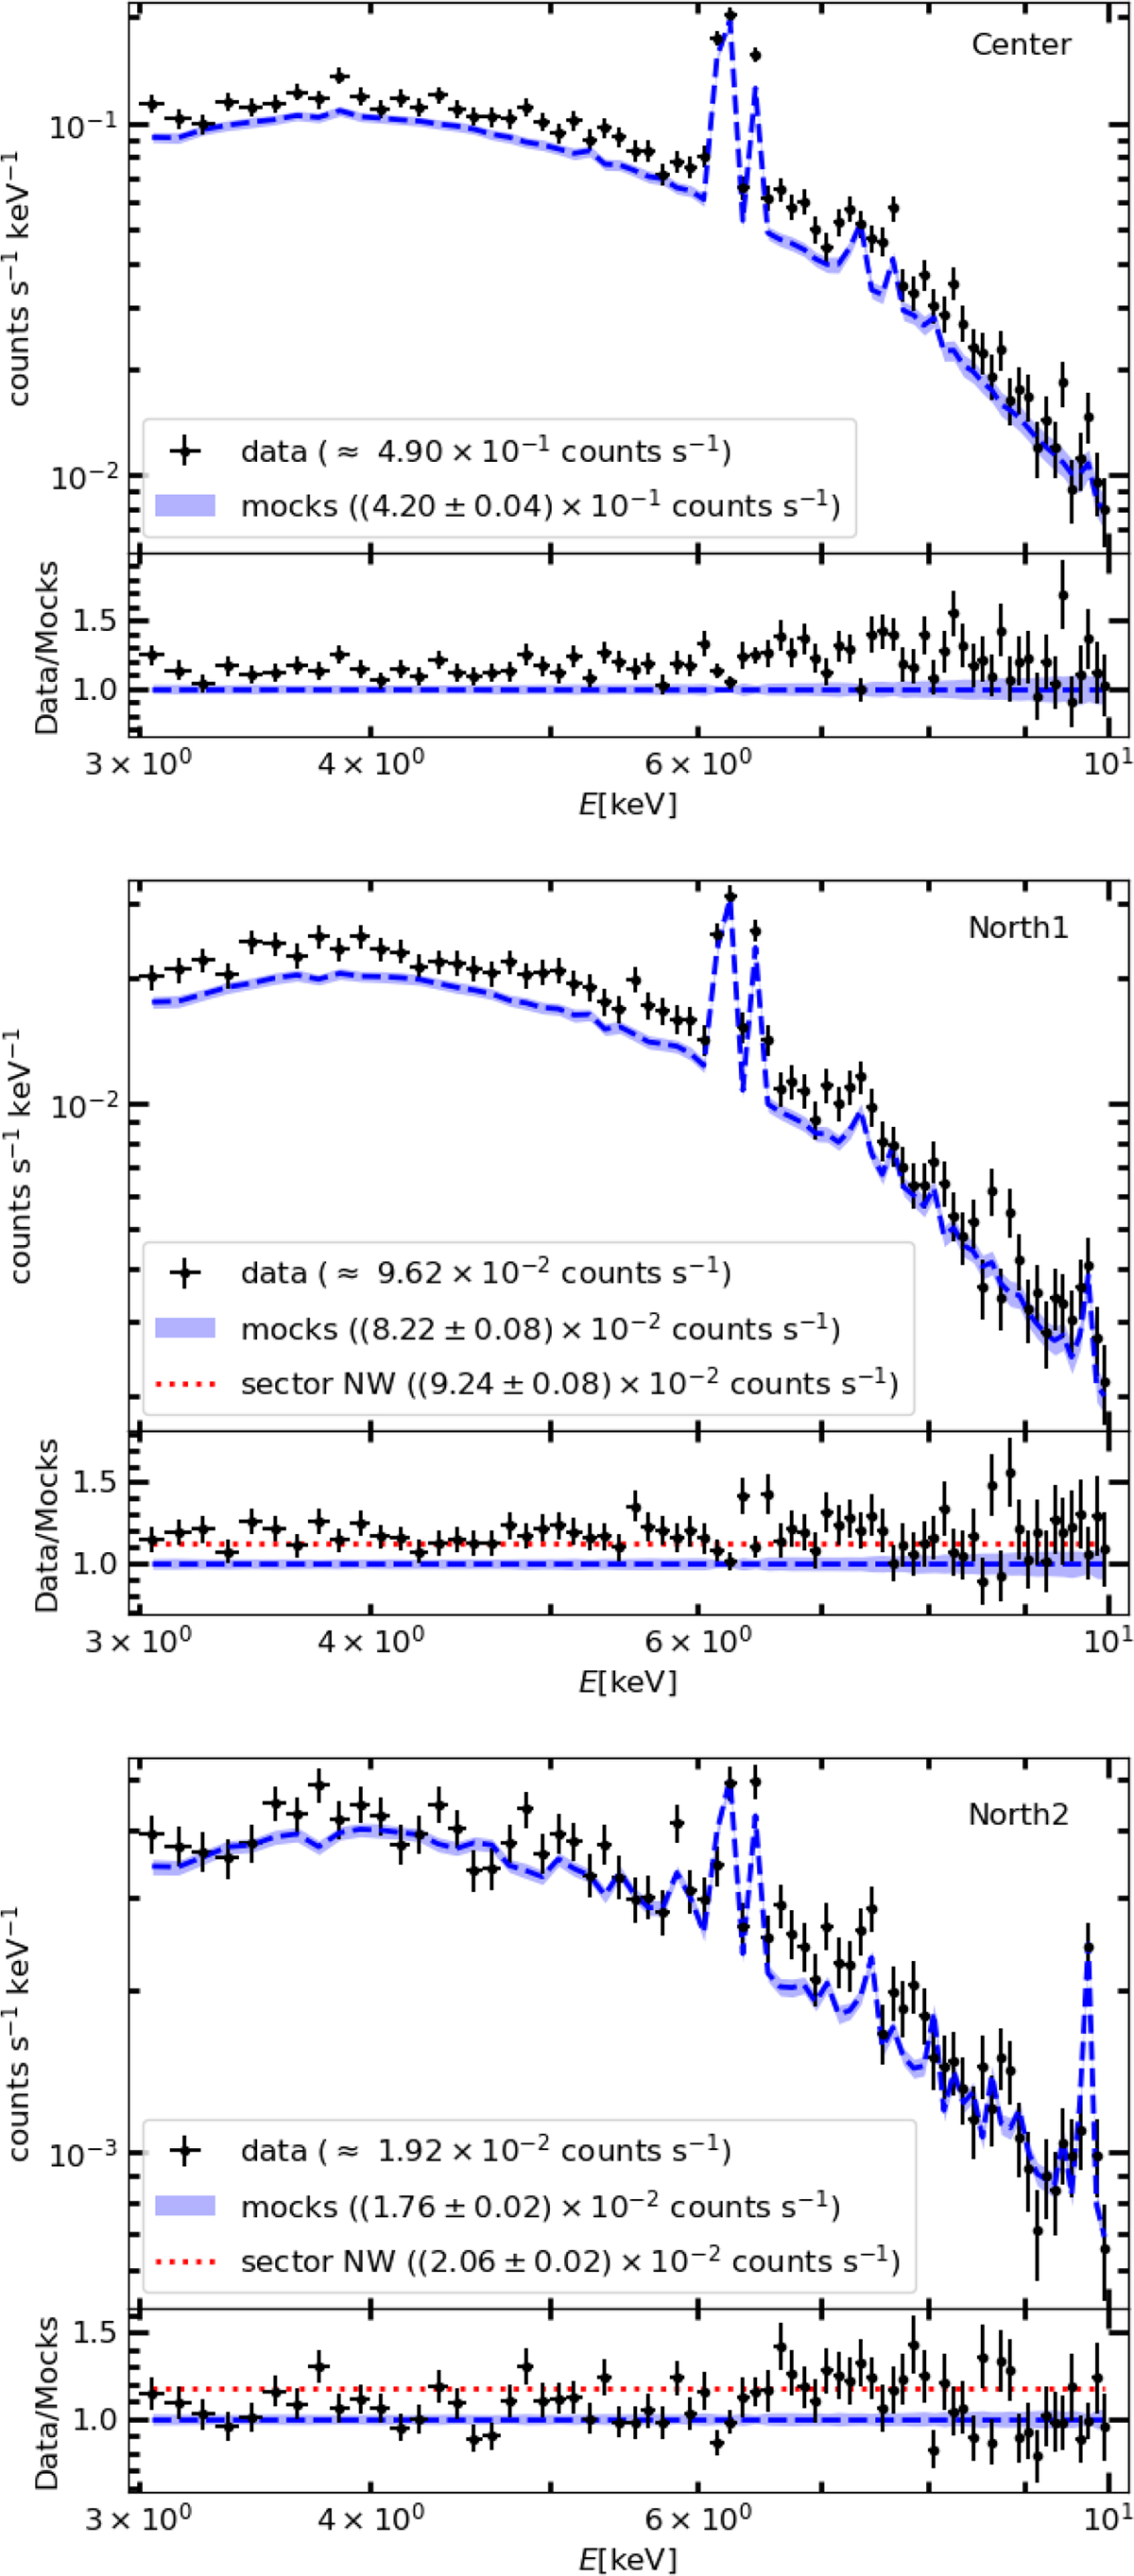
Count rates (upper part of each panel) and residuals (lower part of each panel) of the m = {1, 2, 3} (top, middle and bottom panels, respectively) XRISM/Resolve pointings of A2029 as a function of the spectral energy. The median count rate of the mock spectrum and its 16th–84th percentile interval are represented by the dashed blue line and blue shaded region, respectively. The observational data are the black dots, whereas the black vertical error bars indicate the 1σ uncertainties and the horizontal error bars the bin extent. The value of Raz, m for m = {2, 3} (see text) is indicated by the horizontal dotted red line in the residual panels.
Current usage metrics show cumulative count of Article Views (full-text article views including HTML views, PDF and ePub downloads, according to the available data) and Abstracts Views on Vision4Press platform.
Data correspond to usage on the plateform after 2015. The current usage metrics is available 48-96 hours after online publication and is updated daily on week days.
Initial download of the metrics may take a while.