Fig. 1.
Download original image
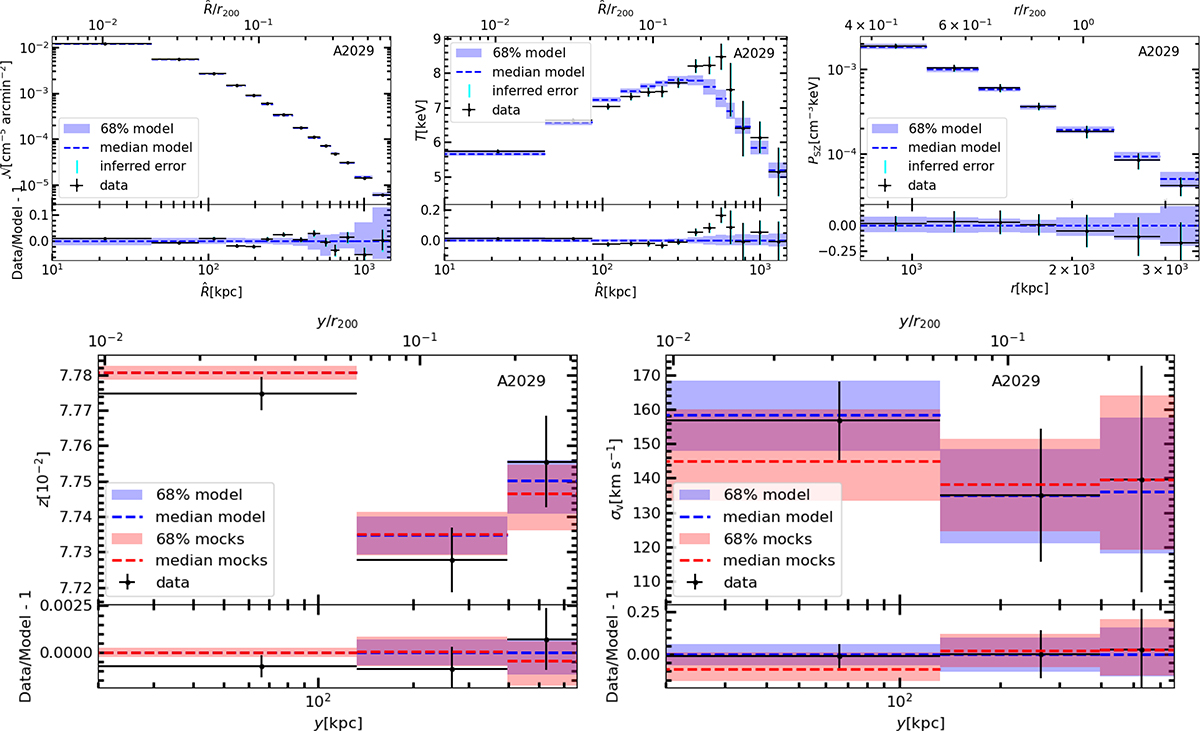
Profiles (upper part of each panel) and residuals (lower part of each panel) of the brightness (![]() ; upper left panel), temperature (T; upper central panel), SZ-derived thermal pressure (PSZ; upper right panel), redshift (zu; lower left panel), and LOS nonthermal velocity dispersion (σv; lower right panel). The observational measurements are the black dots with the horizontal and vertical error bars indicating the bin extents and the 1σ statistical errors, σstat, respectively. The cyan vertical error bars indicate the total errors,
; upper left panel), temperature (T; upper central panel), SZ-derived thermal pressure (PSZ; upper right panel), redshift (zu; lower left panel), and LOS nonthermal velocity dispersion (σv; lower right panel). The observational measurements are the black dots with the horizontal and vertical error bars indicating the bin extents and the 1σ statistical errors, σstat, respectively. The cyan vertical error bars indicate the total errors, ![]() (see Sect. 4.1, for details). The corresponding median values computed from the model and the corresponding median measurements from the mock spectra (see Sect. 5, for details) are the dashed blue and red lines, respectively, while the shaded rectangles span vertically the 16th–84th percentile intervals of the mock measurements. Both the uncertainty in the parameter values from the posterior and the Poisson noise in the mock spectra contribute to the error of the mock measurements, which is estimated as follows. We started with 100 measurements of the quantity Wm extracted from each mock spectrum. We randomly generated 100 values for each mock measurement according to the corresponding error. From the distribution consisting of all the values generated for every mock datum at a given bin, we measured the 16th–84th percentile interval.
(see Sect. 4.1, for details). The corresponding median values computed from the model and the corresponding median measurements from the mock spectra (see Sect. 5, for details) are the dashed blue and red lines, respectively, while the shaded rectangles span vertically the 16th–84th percentile intervals of the mock measurements. Both the uncertainty in the parameter values from the posterior and the Poisson noise in the mock spectra contribute to the error of the mock measurements, which is estimated as follows. We started with 100 measurements of the quantity Wm extracted from each mock spectrum. We randomly generated 100 values for each mock measurement according to the corresponding error. From the distribution consisting of all the values generated for every mock datum at a given bin, we measured the 16th–84th percentile interval.
Current usage metrics show cumulative count of Article Views (full-text article views including HTML views, PDF and ePub downloads, according to the available data) and Abstracts Views on Vision4Press platform.
Data correspond to usage on the plateform after 2015. The current usage metrics is available 48-96 hours after online publication and is updated daily on week days.
Initial download of the metrics may take a while.