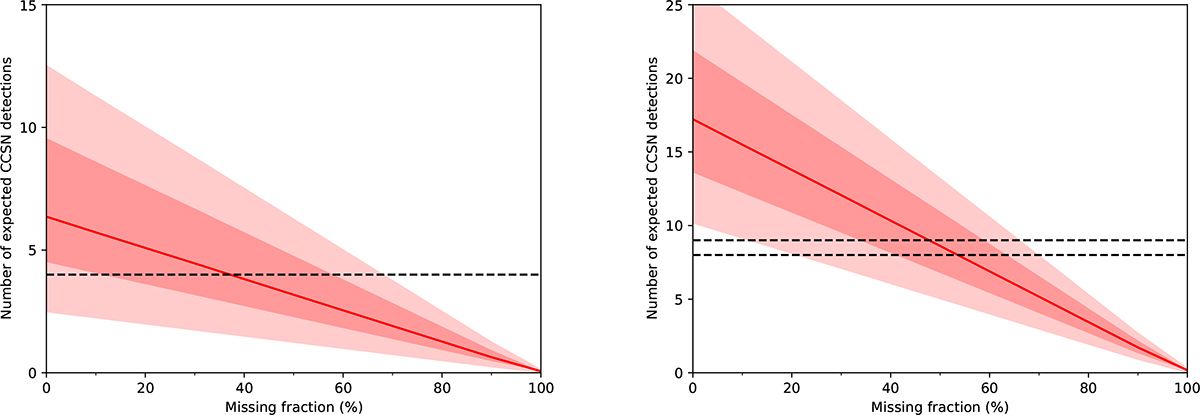
Fig. 5.
Download original image
Number of expected CCSN detections over the survey period of the dataset as a function of the missing fraction. Left: The GSAOI/GeMS dataset. Right: The GSAOI/GeMS dataset combined with the ALTAIR/NIRI dataset from Paper I. Red line: The mean value. Shaded red areas: 1σ and 2σ confidence intervals. Poissonian upper and lower limits due to small number statistics and the cumulative effect of other error sources are combined here. Dashed black: Number of real detected CCSNe in the survey(s). We note that while the expected CCSN counts for the datasets are 9 and 25 CCSNe for GSAOI/GeMS alone, and GSAOI/GeMS combined with ALTAIR/NIRI dataset, respectively, the Monte Carlo simulations result in detecting significantly less CCSNe even at 0% missing fraction. This is caused by a combined effect of faint CCSNe, moderate extinction and long time interval until the next observation epoch within the yielded CT.
Current usage metrics show cumulative count of Article Views (full-text article views including HTML views, PDF and ePub downloads, according to the available data) and Abstracts Views on Vision4Press platform.
Data correspond to usage on the plateform after 2015. The current usage metrics is available 48-96 hours after online publication and is updated daily on week days.
Initial download of the metrics may take a while.