


Fig. 6.
Download original image
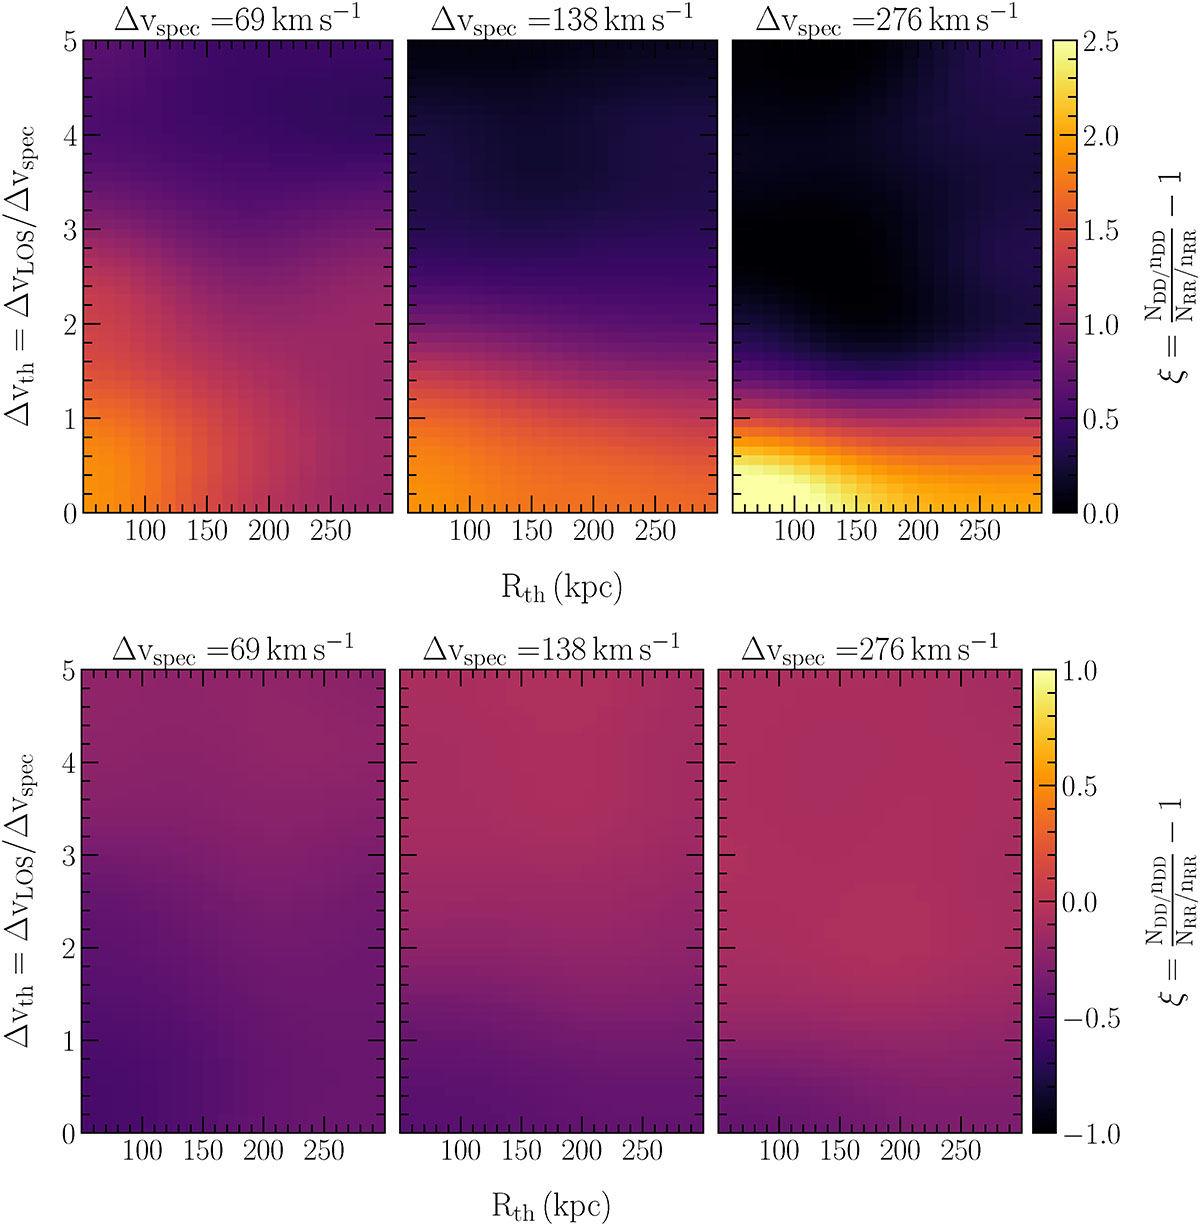
Two-dimensional LAE-absorber cross-correlation functions, ξ. Upper panels: Cross-correlation functions for systems with −0.05 < F < 0.25. The linking velocity window, Δvth, and projected separation, ΔRth, vary along the vertical and horizontal axis, respectively. Each of the three panels shows the results for SBLAs identified in quasar spectra with a pixel size of Δvspec = 69 km s−1 (left panel), 138 km s−1 (middle panel), and 276 km s−1 (right panel). Line-of-sight separations Δvth < Δvspec are masked. Lower panels: Cross-correlation functions between LAEs and systems with F > 0.25. Note the different limits on the ξ color scale.
Current usage metrics show cumulative count of Article Views (full-text article views including HTML views, PDF and ePub downloads, according to the available data) and Abstracts Views on Vision4Press platform.
Data correspond to usage on the plateform after 2015. The current usage metrics is available 48-96 hours after online publication and is updated daily on week days.
Initial download of the metrics may take a while.