


Fig. 4.
Download original image
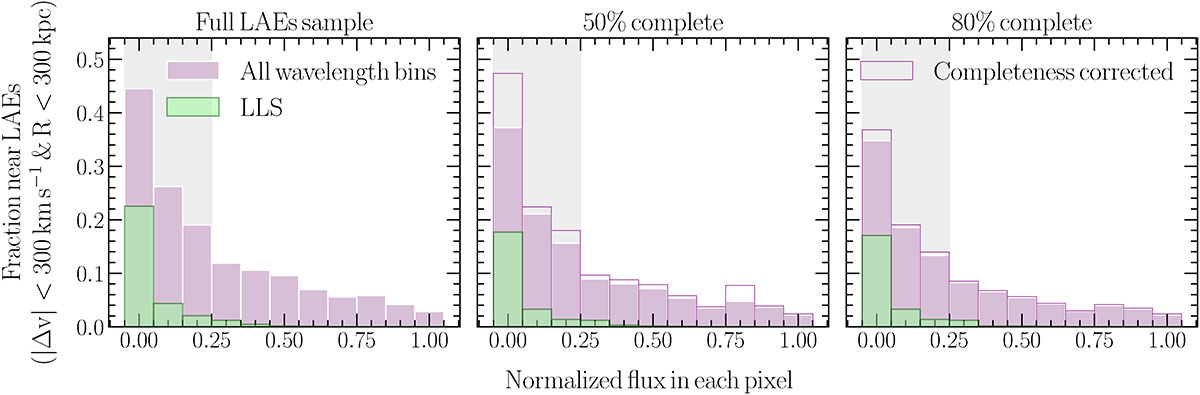
Fraction of 138 km s−1 wavelength bins, as a function of their transmitted fluxes, that are associated with at least one LAE within a projected distance R ≤ 300 kpc and line-of-sight separation |Δv| ≤ 300 km s−1. The pink histograms show the results for all the absorption systems, while the green ones show the contribution to each flux interval of the wavelength bins that are also identified as LLSs. The gray shaded area highlights the wavelength bins with fluxes −0.05 < F < 0.25 that are identified as SBLAs. In the three panels, we show associations with the full sample of MAGG LAEs (left panel), and those above the 50 percent (middle panel) and 80 percent (right panel) completeness limit. Fractions computed with the respective completeness corrections are also shown (purple histogram).
Current usage metrics show cumulative count of Article Views (full-text article views including HTML views, PDF and ePub downloads, according to the available data) and Abstracts Views on Vision4Press platform.
Data correspond to usage on the plateform after 2015. The current usage metrics is available 48-96 hours after online publication and is updated daily on week days.
Initial download of the metrics may take a while.