Open Access
Fig. A.2.
Download original image
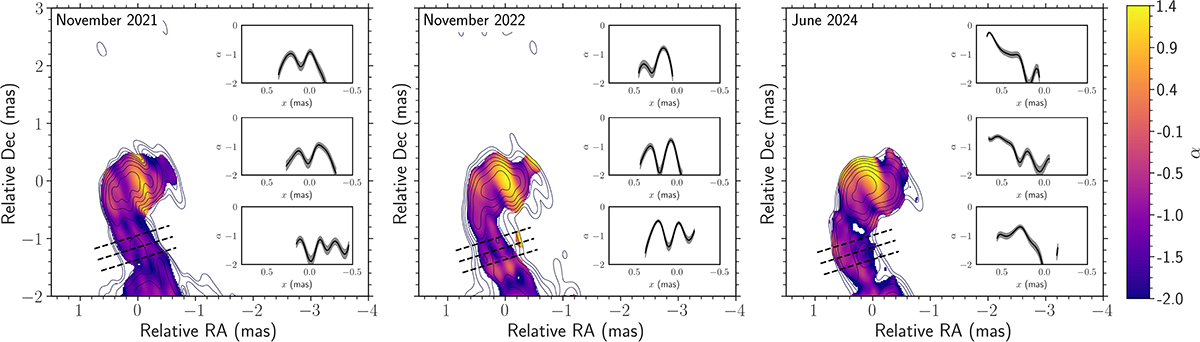
Similar to Fig. 2, but the insets show the spectral indices distributions along slices at ∼1.2 mas, and along parallel-shifted slices at ∼1.0 mas and ∼1.4 mas jet downstream, as indicated by the black dashed lines. The grey shaded area around the inset plot indicates the 10% uncertainty of the spectral index.
Current usage metrics show cumulative count of Article Views (full-text article views including HTML views, PDF and ePub downloads, according to the available data) and Abstracts Views on Vision4Press platform.
Data correspond to usage on the plateform after 2015. The current usage metrics is available 48-96 hours after online publication and is updated daily on week days.
Initial download of the metrics may take a while.