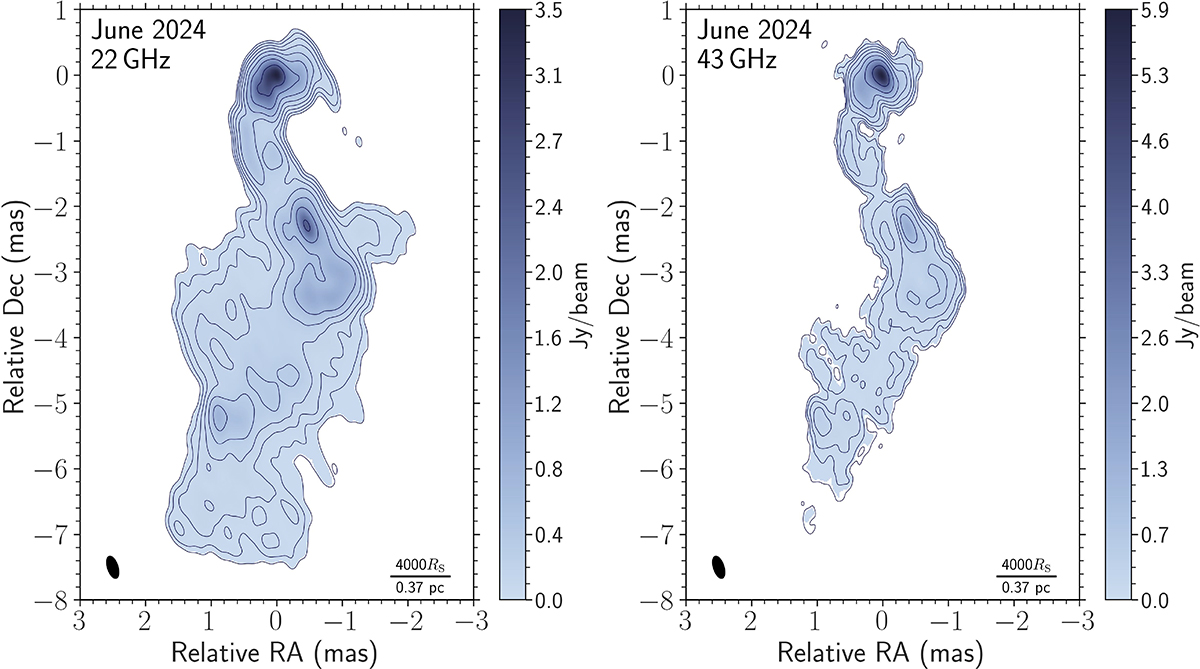
Fig. 1.
Download original image
Total intensity images of 3C 84 at 22 and 43 GHz. The total intensity is represented by the contours, using the contour levels at 0.5, 1, 2, 4, 8, 16, 32, and 64% of the peak flux (Smax, 22 GHz = 3.54 Jy/beam, Smax, 43 GHz = 5.94 Jy/beam). The black ellipse in the bottom left corner denotes the common convolving beam with a size of (0.35 × 0.16) mas at a position angle of 18° (uniform weighting), and the black dash in the bottom right corner denotes the projected distance corresponding to 4000 RS for both frequencies. The cut-off is at 4σI for 22 GHz and at 1.5σI for 43 GHz (σI, 22 GHz = 0.93 mJy, σI, 43 GHz = 4.9 mJy).
Current usage metrics show cumulative count of Article Views (full-text article views including HTML views, PDF and ePub downloads, according to the available data) and Abstracts Views on Vision4Press platform.
Data correspond to usage on the plateform after 2015. The current usage metrics is available 48-96 hours after online publication and is updated daily on week days.
Initial download of the metrics may take a while.