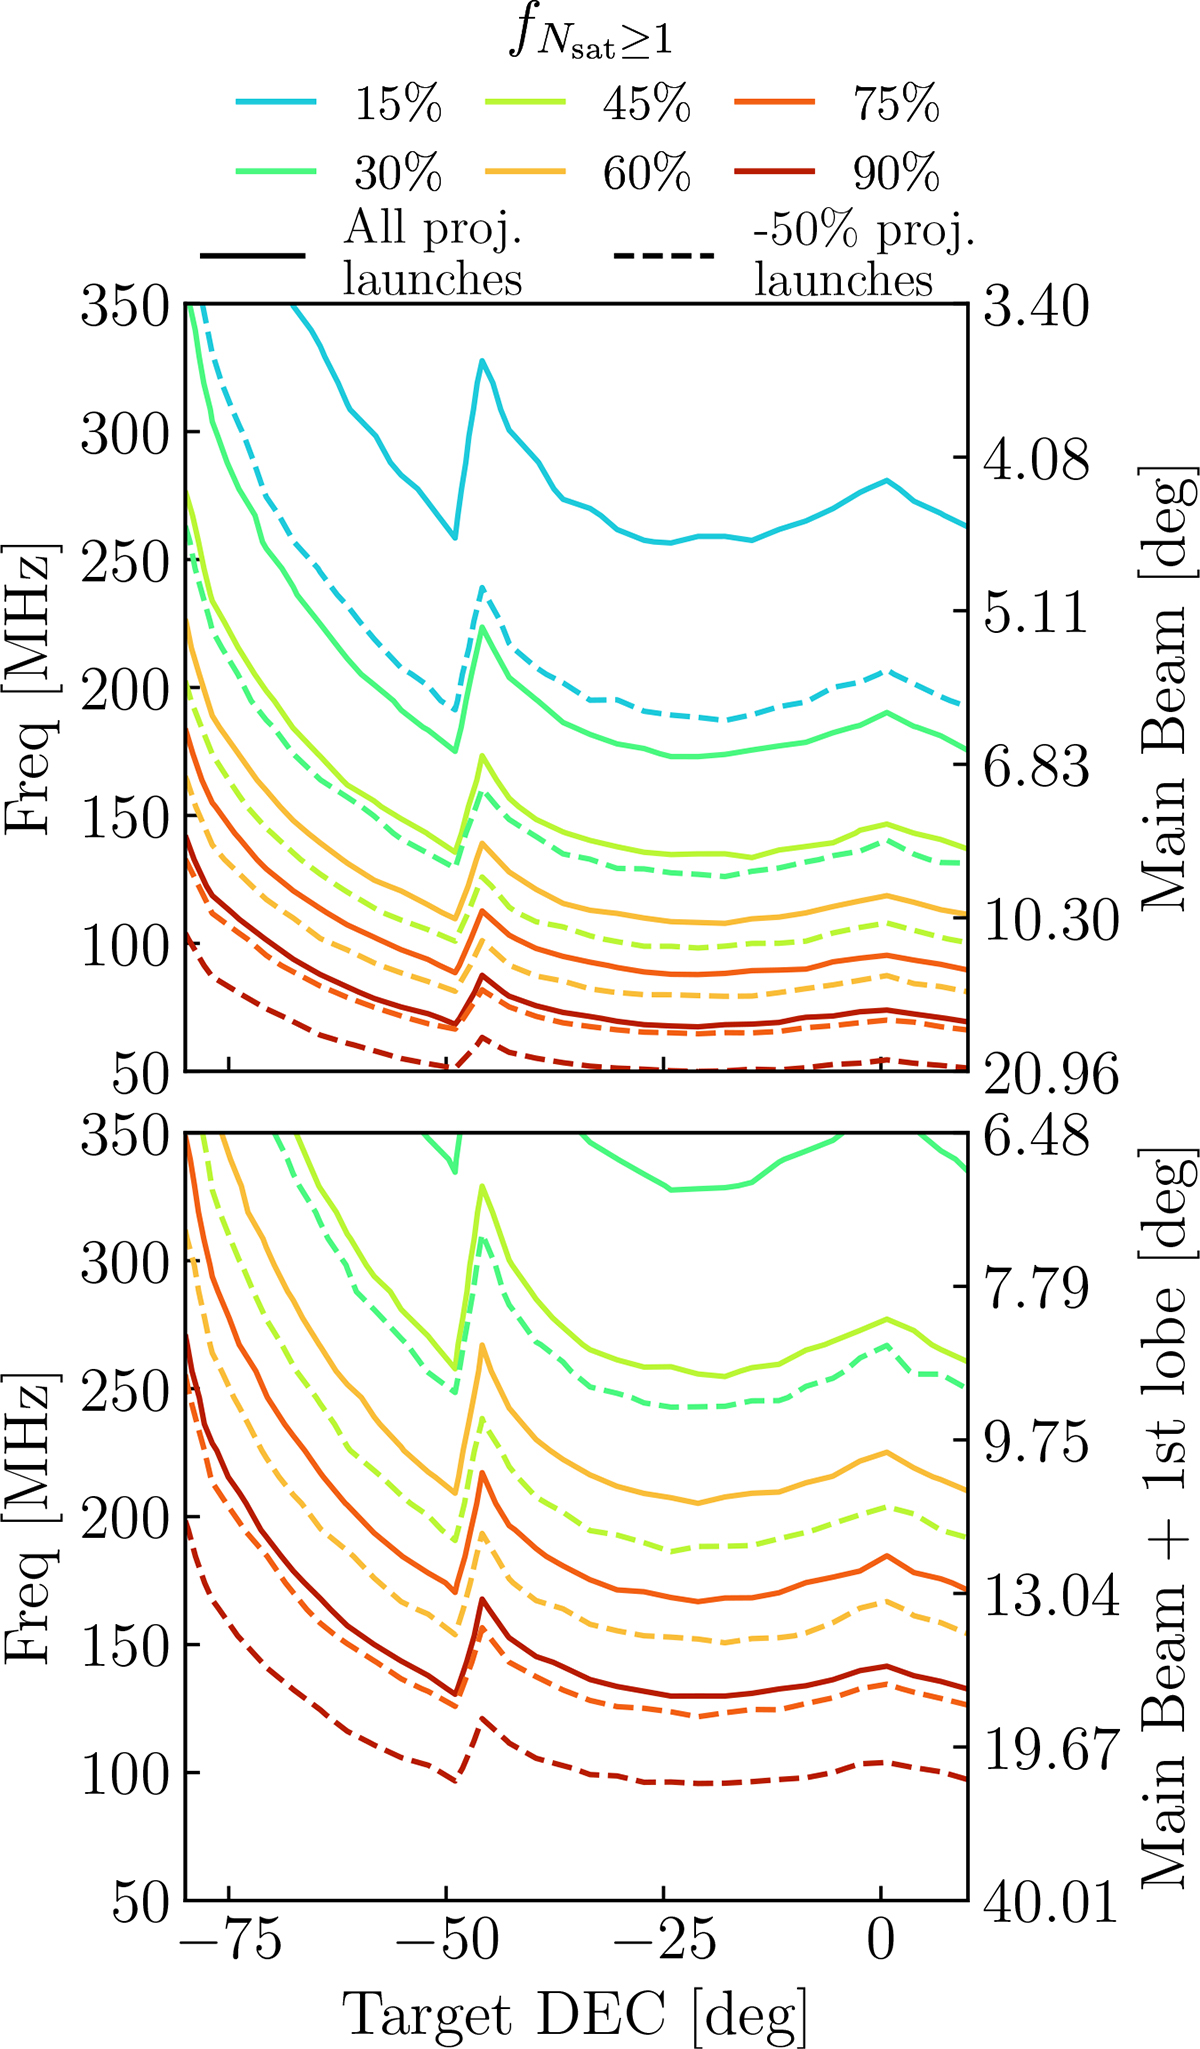
Fig. 3.
Download original image
Forecast of the fraction of time exposed to satellites (fNsat ≥ 1) in SKA-Low, as a function of the observing frequency and the declination of the target. It includes megaconstellations from Table A.1. The top panel shows the analysis counting satellites only in the main beam, whose size varies with frequency. The bottom panel shows the analysis including satellites also in the first sidelobe. Solid lines show the contour for the analysis with all satellites, while dashed lines indicates the contours for the analysis with –50% projected launches.
Current usage metrics show cumulative count of Article Views (full-text article views including HTML views, PDF and ePub downloads, according to the available data) and Abstracts Views on Vision4Press platform.
Data correspond to usage on the plateform after 2015. The current usage metrics is available 48-96 hours after online publication and is updated daily on week days.
Initial download of the metrics may take a while.