| Issue |
A&A
Volume 709, May 2026
|
|
|---|---|---|
| Article Number | A230 | |
| Number of page(s) | 15 | |
| Section | Extragalactic astronomy | |
| DOI | https://doi.org/10.1051/0004-6361/202558303 | |
| Published online | 19 May 2026 | |
Spectropolarimetry of five changing-look active galactic nuclei
1
Université de Strasbourg, CNRS, Observatoire Astronomique de Strasbourg, UMR 7550, 11 rue de l’université, 67000 Strasbourg, France
2
Institut d’Astrophysique et de Géophysique, Université de Liège, Allée du 6 Août 19c, B5c, 4000 Liège, Belgium
★ Corresponding author: This email address is being protected from spambots. You need JavaScript enabled to view it.
Received:
28
November
2025
Accepted:
9
April
2026
Abstract
Context. A growing number of active galactic nuclei (AGNs) show dramatic changes in their spectral classification. The mechanisms behind the appearance and disappearance of the optical broad emission lines, as well as the brightening or fading of AGNs, are still elusive.
Aims. The goal of this study is to investigate this problem from a different angle by using the unique constraints that (spectro)polarimetry can bring.
Methods. We acquired polarized spectra of five “changing-look” AGNs (CLAGNs) using the VLT/FORS2 between July and September 2024, using the 300V grism and a 1″ width slit. The sample consists of IRAS 23226-3843, NGC 1346, NGC 2617, NGC 7582, and NGC 7603.
Results. Three of the five targets show newly re-emerged broad-line components associated with low-polarized, often wavelength-independent continua, attributed to electron scattering in an equatorial region seen close to pole-on. Their associated broad Hβ lines are systematically blueshifted, while their Hα profiles are predominantly double-peaked around the central emission wavelength, indicative of a kinematically disturbed or disk-dominated region responding to ionizing continuum changes. The remaining two objects do not show clear evidence of any newly emerged polarized broadline emission.
Conclusions. Our findings are consistent with accretion-driven changes as the dominant driver of the observed spectral evolution in CLAGNs, with polarimetric properties that are broadly compatible with this interpretation for four out of the five sources.
Key words: polarization / instrumentation: polarimeters / methods: observational / galaxies: active / galaxies: evolution / galaxies: Seyfert
© The Authors 2026
 Open Access article, published by EDP Sciences, under the terms of the Creative Commons Attribution License (https://creativecommons.org/licenses/by/4.0), which permits unrestricted use, distribution, and reproduction in any medium, provided the original work is properly cited.
This article is published in open access under the Subscribe to Open model. This email address is being protected from spambots. You need JavaScript enabled to view it. to support open access publication.
1. Introduction
Since the pioneering work of Carl K. Seyfert in 1943, active galactic nuclei (AGNs) have been classified according to their extremely bright optical nuclear emission lines, which can display broad and/or narrow components and high-ionization species (Seyfert 1943). Based on their spectral appearance, AGNs are labeled as type-1.0, 1.2, 1.5, 1.8, 1.9, or 2 (Osterbrock 1977). Although peculiar exceptions exist, what effectively separates the two main categories (1.X or 2) is the presence (in the former case) or complete absence (in the latter case) of broad optical emission lines with a full width at half maximum (FWHM) ≥ 2000 km s−1, in addition to narrow components and a power-law continuum.
The usual optical broad lines detected in type-1.X AGN spectra are the Balmer hydrogen series (especially Hα and Hβ, often Hγ too), as well as strong permitted lines such as He Iλ5876 and He IIλ4686. In the ultraviolet, broad C IVλ1549, Mg IIλ2798, and Lyα are also typically observed (Kollatschny & Zetzl 2013; Marziani et al. 2020). In the near-infrared, type-1.X AGNs show broad permitted transitions such as the Paschen and Brackett hydrogen series (Paα, Paβ, Brγ), along with strong He I lines (notably He I 1.083 μm and 2.058 μm), see Landt et al. (2008). Additional broad components can be detected in O I 1.1287 μm and 1.3165 μm, which often arise from Bowen fluorescence or Lyβ pumping (ibid.). These near-infrared lines are particularly valuable for probing the broad-line region (BLR) in obscured or reddened AGNs, as extinction decreases significantly with wavelength. Narrow-line regions (NLRs), visible in both type-1 and type-2 AGNs, are instead dominated by forbidden transitions such as [O III] λ5007, [N II] λλ6548, 6583 and [S II] λλ6717, 6731 (Heckman et al. 1981).
When this classification was established, AGN types were originally interpreted primarily in terms of orientation, implying that changes in type were not expected, since such objects extend over parsec-scale distances and had been expected to evolve on timescales far exceeding a human lifetime. However, several objects began to show transitions in their spectral appearance, such as NGC 1566, whose nuclear Hβ and Hα emission line profiles varied so much between December 1980 and January 1982 that its classification was changed from type-2 to type-1 (Alloin et al. 1985). Another example is NGC 7603, whose Hβ emission line profile became much weaker between November 1974 and November 1975, and then it apparently increased slightly by February 1976 (Tohline & Osterbrock 1976). Since then, many “changing-look” AGNs (CLAGNs) have been found, although they do not make up the largest fraction of AGNs (see, e.g., Dong et al. 2025).
The reason why some AGNs transition from one spectral type to another, sometimes within months or even weeks (Tohline & Osterbrock 1976; Alloin et al. 1985; Risaliti et al. 2005), is still not fully understood. However, the most promising explanation is that changes in the BLR, which is responsible for the Keplerian-broadened permitted lines, are directly connected to these “changes in the look” of these objects. The BLR typically spans light-days to light-weeks, corresponding to physical scales of about 10−2–10−1 parsecs (Peterson 2006). Because this region is “small”, highly dynamical, and responds quickly to variations in ionizing flux, its observable properties can change on timescales of days to years, making spectral-type transitions entirely possible (Noda & Done 2018). Now, the key question is related to which specific physical processes can alter the BLR sufficiently to suppress, or temporarily extinguish, the production of broad emission lines.
Changes in the accretion rate and ionizing continuum, variations in the BLR density or the ionization parameter, the disappearance of high-velocity gas, and variable dust extinction on parsec or sub-parsec scales are all viable solutions (Ricci & Trakhtenbrot 2023). Alternative explanations, linked to case-specific CLAGNs, also include supernovae, which can explain the appearance and sudden disappearance of a broad line, but fails to explain the observed cases where the broad line reappears several years later (Komossa et al. 2024). Furthermore, luminous flares produced by the tidal disruption of a supersolar mass star passing just a few gravitational radii outside the event horizon of the central supermassive black hole might also provide a viable explanation (Campana et al. 2015; Blanchard et al. 2017); however, this scenario implies a periodicity that most CLAGNs lack.
Many observational techniques have been used to try to distinguish the different hypotheses: photometric monitoring, spectroscopic surveys, and imaging. However, polarimetry, the sole method that reliably gives geometric information on a source of polarized light, has scarcely been employed, despite promising attempts (Hutsemékers et al. 2017, 2019, 2020). It represents a lack of opportunity, since it was shown in Marin et al. (2013) and in Marin (2017) that different changing-look scenarios produce different polarized signatures. In the obscuration scenario, the direct emission is blocked, so the observed light is likely to be dominated by photons scattered perpendicularly in the polar winds. This naturally produces high polarization degrees through the Malus law and a 90° rotation of the polarization angle between the type-1 and type-2 phases. In contrast, a decrease in the ionizing continuum does not modify the scattering geometry, and therefore should leave the polarization degree and angle that characterizes type-1 AGNs unchanged. Unfortunately, we lack both archival and recent (spectro)polarimetric data for most of the known CLAGNs, which complicates any attempt to determine the dominant driver of the observed spectral and polarimetric evolution.
For this reason, we applied for observing time with the Very Large Telescope (VLT) FOcal Reducer/low dispersion Spectrograph 2 (FORS2) in spectropolarimetry and acquired the spectrum of five know CLAGNs without previous known spectropolarimetric data between July and September 2024. In Sect. 2, we present the five CLAGNs we selected, the observational method and the data reduction pipeline, as well as our estimates of the intervening (polluting) interstellar polarization. In Sect. 3, we analyze each CLAGN individually before discussing our results in Sect. 4. We conclude our paper in Sect. 5, where we summarize our findings.
2. Observation
In the following, we present the five sources that we observed during our spectropolarimetric campaign using the VLT/FORS2. We review their basic properties (see Table 1) and latest spectral type prior to our observations. We also expose the data reduction process and define the important quantities (polarization degree and angle) to be used throughout this article.
Our CLAGN sample.
2.1. The sample
The sample contains five CLAGNs that had not previously been observed in spectropolarimetry. They were selected on the basis of their previously known spectral type and for their individual brightness to ensure a detection of their polarized counterpart.
IRAS 23226-3843. The first object is IRAS 23226-3843, also known as 2MASX J23252420-3826492. It is an AGN that was classified as a type-1 object back in the beginning of the 1990’s (Allen et al. 1991), whose optical, ultraviolet, and X-ray fluxes have shown a progressive dimming over the years (Kollatschny et al. 2023). Most notably, its Hα emission line profile displayed a blue-peaked structure between 1997 and 1999, which later evolved into a double-peaked profile in 2017. Despite a strong multi-wavelength outburst observed in 2019, the double-peaked structure remained largely unchanged but, by 2020 (after the outburst), the optical spectrum of IRAS 23226-3843 no longer showed evidence for broad emission lines at all. The source was (until today) classified as a type-2 AGN (Kollatschny et al. 2023).
NGC 1346. The second CLAGN in our list is NGC 1346. It was initially classified as a Seyfert-1 galaxy (Véron-Cetty & Véron 2003) based on SDSS spectra from 2001, which displayed a broad Hα emission line component. However, subsequent observations in 2004 (6dFGS, Jones et al. 2009) and later (S7 – Dopita et al. 2015, and WiFeS 2018 – Senarath et al. 2019) revealed only narrow emission lines, indicating that the galaxy transitioned from a type-1 AGN to a type-2 between 2001 and 2004 (Senarath et al. 2021). Infrared photometry (Ks band) confirmed a significant fading of 0.82 mag between 1998 (2MASS catalog) and 2018 (IRSF catalog), at a time when the source was still in a type-2 phase (Senarath et al. 2019, 2021).
NGC 2617. The third object, NGC 2617, was classified as a Seyfert-1.8 galaxy in 1994 (Moran et al. 1996), namely, an AGN with very weak broad emission lines that are potentially partially obscured by intervening material. In 2013, Shappee et al. (2014) reported a significant optical brightening of NGC 2617, leading to its transition to a Seyfert-1 galaxy until 2023. Following this, the XMM-Newton and Swift telescopes conducted extensive monitoring, revealing a notable increase in the galaxy’s 0.3–10 keV X-ray flux (Giustini et al. 2017). NGC 2617 has been under heavy scrutiny since then (Oknyansky et al. 2017, 2023, 2025), showing a recent (2019–2021) dimming in continuum, with a slow weakening of the broad Hβ line, indicating that the source was coming back to its type-1.8 classification. Between October 2023 and January 2024, NGC 2617 appeared to be in a type-1.9 state, but then seemed to evolve to a 1.5 classification on February 2024, a few months of our observation (Oknyansky et al. 2025).
NGC 7582. The fourth object in our study, located at approximately 20 Mpc, is one of the nearest starburst galaxies that harbors an obscured AGN. Indeed, NGC 7582 is classified as a type-2 AGN, in which no persistent broad lines, even in polarized spectra, were detected in the 1980s or ’90s (Ward et al. 1980; Heisler et al. 1997). However, in 1998, several permitted lines (Hα, Hβ, Na I, and Fe II) suddenly broadened before disappearing after a few weeks (Aretxaga et al. 1999). Because of the intense starburst activity within the host galaxy, the reason behind this broadening was attributed to a supernova near the active nucleus, but an intrinsic flare from the accretion disk (e.g., via star capture) remains equally possible. Since then, the AGN remained in a type-2 state (Lefkir et al. 2023). It makes it a particularly interesting target, as the specific CLAGN in our sample that showed the swiftest type transition; in addition, it is the most widely known CLAGN to date to be associated with a potential tidal disruption event.
NGC 7603. The final CLAGN of our survey, occasionally denoted as Mrk 530 or Arp 92, is a distorted spiral galaxy that is interacting with a smaller, elliptical companion called PGC 71041 (Arp 1980). When it was first observed in spectroscopy, it showed prominent, broad recombination H I emission lines and narrow forbidden emission lines of various ions, the typical signatures of a type-1 nucleus (Arp 1971). However, in 1975, all its broad components had vanished (Tohline & Osterbrock 1976), although the broad emission partially reappeared a year later. According to Jana et al. (2025), NGC 7603 remained in a type-1 state between 1976 and 2009, changed to a type-1.8 classification in 2012, and went back to a type-1 state until 2019 (Koss et al. 2022).
2.2. Observation and data reduction
Spectropolarimetric observations were obtained using the European Southern Observatory (ESO) VLT/FORS2 mounted at the Cassegrain focus of Unit Telescope #1 (Antu). Linear spectropolarimetry was performed by inserting a Wollaston prism in the beam, which splits the incoming light rays into two orthogonally polarized beams separated by 22″ on the CCD detector. To derive the normalized Stokes parameters u and q, two consecutive series of frames were obtained at a given epoch with the half-wave plate rotated at four different position angles: 0°, 22.5°, 45°, and 67.5°. This combination allowed us to remove most of the instrumental polarization. The polarization data were extracted independently for the two series of frames. Since they did not show any significant difference, we only considered the average of the derived Stokes parameters for each epoch.
The spectra were acquired with the grism 300V and the order-sorting filter GG435 (4600–8650 Å). The slit width was 1″ on the sky, providing us with an average resolving power of R ≈ 440 around 5849 Å, which was enough to correctly sample the broad emission lines. The slit was positioned along the north-south direction. The CCD pixels were binned 2 × 2, which corresponds to a spatial scale of 0.25″ per binned pixel. Observational circumstances are reported in Table 1. Polarized and unpolarized standard stars (Fossati et al. 2007) were also observed: Vela1-95 on April 1, Hiltner 652 on July 26, and August the 28, HD42078 on April 1, and WD 1620-391 on August 28. The instrumental polarization estimated from the unpolarized standard stars is lower than 0.1%. This is compatible with the instrumental polarization accurately measured by ESO1, Pinst = 0.03%. Thus, in addition to the formal statistical uncertainties derived from photon noise, we adopted a conservative instrumental floor following Cikota et al. (2017) and imposed a minimum uncertainty of 0.1% on the polarization degree and 0.3° on the polarization angle, representative of the long-term stability of FORS2 spectropolarimetry. We note that these systematic terms have been added to the statistical errors throughout this paper.
Raw frames were first processed to remove cosmic-ray hits using the Python implementation of the “lacosmic” package (van Dokkum 2001; van Dokkum et al. 2012). The ESO FORS2 pipeline (Izzo et al. 2019) was then used to obtain images with 2D spectra that were flat-fielded, rectified, and calibrated in wavelength. The 1D spectra were extracted using an aperture of 2.75″ (11 pixels) for all targets and epochs. This aperture corresponds to 2.75 times the typical seeing value of 1″. It was chosen as small as possible to minimize the host contamination, while maintaining enough flux. The sky spectrum was estimated from adjacent MOS strips and subtracted from the nucleus spectrum. The normalized Stokes parameters u and q were then computed from the ordinary and extraordinary spectra according to the procedure described in the FORS2 manual2 and corrected for the half-wave plate chromatic dependence. The total flux was corrected for the atmospheric extinction and calibrated using a master response curve. Uncertainties were estimated by propagating the photon and readout noises. The polarization degree P and polarization angle θ were finally computed using the standard formulae,
 (1)
(1)
and
 (2)
(2)
where Δ = 0° for u > 0 and q > 0; 90° for q < 0; and 180° for u < 0 and q > 0, according to the usual north-south convention (0° in the north, 90° in the east). The final uncertainties on P and θ were propagated from the errors of the Stokes parameters. In particular, the uncertainty on the polarization position angle is obtained from standard error propagation of Eq. (2), yielding
 (3)
(3)
However, because we are in the low-signal-to-noise ratio (low-S/N) regime, the normalized Stokes parameters are only estimates of their true values, and the derived polarization degree ends up positively biased. To correct for this effect, we adopted the debiased polarization degree as an improved estimator, defined in each spectral bin as  , following Simmons & Stewart (1985). This debiasing was applied independently in every wavelength bin of the polarization spectra, as well as to polarization values integrated over broader spectral ranges. The polarization angle is unaffected by this correction.
2.3. Interstellar polarization
To check whether our data were contaminated by Milky Way’s interstellar polarization (i.e., the effect of dust and magnetized interstellar medium (ISM) on the observed polarization of our CLAGNs), we used the compilation of optical starlight polarization catalogs presented by Panopoulou et al. (2025). For each of our sources, we selected the closest star with available polarimetric measurement from the compilation and retrieved its q and u Stokes parameters to compute PISP and θISP, which we later compared to our polarization spectra. This is an approximation, since the interstellar polarization is wavelength-dependent (Serkowski et al. 1975). Table 2 lists the different stars used in our study and presents their observed optical linear polarization.
Interstellar polarization toward our targets.
3. Case-by-case analysis
3.1. IRAS 23226-3843
The total flux spectrum of IRAS 23226-3843 is shown in Fig. 1 (top-left). The presence of a broad Hα emission line is striking, even if telluric absorption cuts off a part of its red wing. The same applies to the Hβ emission line, which appears quite broad. Additional broad blue absorption components near the broad lines are also present, as it was already observed in the Kollatschny et al. (2023) analysis of the past type-1 period of IRAS 23226-3843. To estimate the full width at half maximums (FWHM) of the broad emission lines, we fit the total flux spectrum using a power-law continuum and Lorentzian profiles, including the contribution of the narrow forbidden lines that contaminate the Balmer profiles (e.g. [N II] around Hα) and removed them before estimating the properties of the broad components. Out fits (see Appendix A) show a single emission structure for Hβ with a FWHM on the order of 2700 km s−1, while the Hα profiles needs three components, with FWHMs between 2100 and 4000 km s−1, but form a double-peaked structure overall as the central Lorentzian has a smaller intensity peak (see Table 3). In both cases, the broad lines are blueshifted. The FWHMs we report are smaller than what was observed previously (about 11 000 km s−1 before the 2019’s outburst) by Kollatschny et al. (2023), likely indicating that the BLR is recovering from the its 2020’s type-1 to type-2 spectral transition.
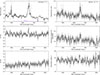 |
Fig. 1. VLT/FORS2 spectropolarimetry of the CLAGN IRAS 23226-3843. The top-left figure shows the total flux spectrum (in arbitrary units). The most prominent telluric absorption lines are indicated in purple. The middle- and bottom-left figures present the Q/I and U/I normalized Stokes parameters. The top-right panel shows the polarized flux, that is the multiplication of the total flux with the polarization degree. The middle-right panel presents the debiased linear polarization degree while the bottom-right panel shows the polarization position angle. Except for the total flux panel, spectra were rebinned to 10 consecutive pixels. 1σ observational errors are indicated for each spectral bin, as well as the main, prominent, broad, and narrow emission lines. |
Hα and Hβ line widths, peak fluxes and velocity shifts in our CLAGN sample.
The debiased polarization from IRAS 23226-3843 is shown, for the first time to date, in Fig. 1. The data were binned by 10 pixels to increase the S/N in polarization per spectral element. The normalized Q and U Stokes fluxes show a relatively low polarization, but with distinctive features. This translates into the debiased polarization degree spectrum where we see that the Pd integrated over the whole spectrum is low, 0.32% ± 0.1%, but still significantly higher than the instrumental polarization and than the ISP (see Table 2). In addition, the debiased polarization degree shows a mild but coherent decrease toward longer wavelengths, while abrupt wavelength-dependent features are observed in the vicinity of the Hα emission line (discussed separately later on in this work). This trend would support the notion of dust scattering, rather than electron scattering because the scattering efficiency and resulting polarization induced by dust grains are intrinsically wavelength-dependent, typically decreasing toward the red. On the other hand, electron (Thomson) scattering is achromatic and would produce a nearly flat polarization spectrum (Kartje 1995). From the work of Kollatschny et al. (2023), we know that the host starlight contributes to approximately 50% of the light we collected with the FORS2, so it means that the true, intrinsic AGN component is polarized at about 0.64%, a value that is in agreement with what is expected from type-1 AGNs (Marin 2014). The polarization angle, integrated over the whole waveband is 138.7° ± 0.9° and shows no strong wavelength-dependence within the observational errors. It is, unfortunately, impossible to compare this polarization position angle with the direction of the radio structure in IRAS 23226-3843, since there is no known measurement of the jet direction in this source: the CLAGN appears as a point source in the 1.4 GHz NRAO VLA Sky Survey (Condon et al. 1998).
The polarized flux spectrum of IRAS 23226-3843, that is the multiplication of the total flux with Pd shows the most interesting features around the Hα emission line wavelength: we observed indications of two maxima in polarized flux located on either side of the nominal Balmer-line wavelength, although the separation remains small and comparable to the spectral binning. This suggests that the Balmer lines are intrinsically polarized and is consistent with the reappearance of double-peaked broad emission in IRAS 23226-3843, albeit at a lower contrast than observed in 2017–2019. However, the substantially smaller FWHM compared to 2017–2019 indicates that only the outer parts of the disk are currently illuminated, pointing to a partial (rather than a full) reactivation of the double-peaked BLR. Broad, double-peaked Balmer lines have been observed in polarization in the past (see, e.g., 3C 332, Corbett et al. 2000), although the peak separation in IRAS 23226-3843 appears significantly smaller. In addition, they are either associated with scattering inside a disk-like, equatorial region or scattering by particles situated above the poles of the torus (Corbett et al. 2000; Lee 2011). The presence of double-peaked, broad Hα emission lines, supported by spectral decomposition in total flux and visible in polarized flux, suggests a scattering-dominated mechanism. This would likely involve a disk-like BLR configuration or material above the torus, but the lack of a detectable radio jet direction prevents us from making any direct comparisons between the polarization and any large-scale AGN structure. Thus, determining which of the two mechanisms is the correct one remains a challenge.
3.2. NGC 1346
The case of NGC 1346 is particularly interesting and since it has been previou covered in another publication (Marin et al. 2025b), so we only summarize the major findings here, before exploiting those results in a broader view presented in the subsequent section. Two spectra were acquired almost a month apart (August 12 and September 4, 2024) and they do show signs of evolution, both in terms of total and polarized fluxes. The spectra are shown in Fig. 2. While the total flux spectra remain similar overall, the second observation exhibits a slightly higher continuum flux and a newly emerged broad, blueshifted component in the Hα and Hβ emission lines. As presented in Table 3, the FWHMs of both Hα and Hβ are about 2100 km s−1, associated with a strong blueshift. Our observation caught NGC 1346 during a transition between a type-2 phase, as classified in 2018 (Senarath et al. 2021), and a type-1 phase.
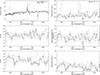 |
Fig. 2. VLT/FORS2 spectropolarimetry of the CLAGN NGC 1346. Two observations, taken nearly a month apart, are shown. Except for the total flux panel, spectra were rebinned to 40 consecutive pixels. The rest of the legend is the same as Fig. 1. |
Polarimetric measurements (see Fig. 2) reveal a low debiased polarization degree (0.27% ± 0.1%), likely affected by host galaxy dilution. The observed debiased polarization is higher than the instrumental polarization, but it does remain comparable, both in terms of the degree and angle, to the ISP (see Table 2), indicating that the true nuclear polarization is even weaker and maybe even absent. After ISP correction, Marin et al. (2025b) reported a decrease of the integrated polarization from ∼0.15% to ∼0.09% within a month, accompanied by a small rotation in position angle (∼10°); however, the low S/N of the polarization measurements limits the significance of this apparent variability.
At least, the low debiased polarization degree is consistent with type-1 AGN behavior, supporting the spectral classification change. Alas, archives show no previous polarimetric measurements of the same source and no radio maps are available to determine the orientation of the measured polarization position angle with respect to the direction of the radio axis in NGC 1346. Therefore, drawing any further conclusions about the alignment (or the lack of) of the small- and large-scale structures in this CLAGN is not feasible at this time.
3.3. NGC 2617
The case of NGC 2617 is shown in Fig. 3. The total flux spectrum presents a rather flat continuum associated with strong, broad emission lines. Line fitting requires a single, blueshifted Hβ Lorentzian profile with FWHM ∼2700 km s−1, and two Hα Lorentzian profiles with FWHMs ∼ 1700–2600 km s−1. One Hα peak is blueshifted by the same velocity than the Hβ line (about 1000 km s−1), while the other component is more strongly redshifted (see Table 3). We conclude that NGC 2617 is in a type-1 spectral state, which implies a new changing-look event since the 1.5 classification in February 2025 (Oknyansky et al. 2025).
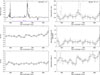 |
Fig. 3. VLT/FORS2 spectropolarimetry of the CLAGN NGC 2617. Except for the total flux panel, spectra were rebinned to 70 consecutive pixels. The rest of the legend is the same as in Fig. 1. |
The integrated debiased polarization is 0.11% ± 0.1% at 142.6° ± 2.7°. It is at the same level than the instrumental polarization and it appears to be ISP-dominated, as shown in Table 2. There is, to our knowledge, only one past polarimetric observation of this source, taken in 1998 by the McDonald Observatory’s 2.1m Struve reflector and the Breger photopolarimeter (see Wills et al. (2011) and Marin et al. (2019)). The archival polarization is P = 0.43% ± 0.15% at 16° ± 10°, in a 7.6″ aperture, but the measurements are dubious according to the note accompanying the archival data remarking “no obv. nucl.” Interestingly, however, NGC 2617’s polarization position angle (if indeed trustworthy) appears parallel to the –35° ± 2.3° radio position angle derived by Yang et al. (2021) using the very long baseline interferometric (VLBI) observations with the European VLBI Network at 1.7 and 5.0 GHz, confirming its type-1 spectral classification (Antonucci 1993).
3.4. NGC 7582
NGC 7582 was observed three times, a few days apart, in July and August 2024. Because none of the individual spectra show any statistically significant variation one from each other, we took the median values of the Stokes parameters to improve statistics and remove artifacts, since the median estimator is less sensitive to outliers (cosmic rays, sky flare, tracking error, variable instrumental effect, etc.). The resulting spectra are shown in Fig. 4. The continuum flux of this CLAGN appears relatively flat, with a hint of reddening, superimposed with bright, narrow emission lines. Fitting the Balmer lines with Lorentzian profiles confirms that the Hβ and Hα FWHMs are narrow (∼500–700 km s−1), see Table 3. Such type-2 classification is consistent with the decades old observation of Aretxaga et al. (1999) and with the more recent ones from Lefkir et al. (2023).
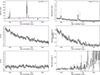 |
Fig. 4. VLT/FORS2 spectropolarimetry of the CLAGN NGC 7582. Except for the total flux panel, spectra were rebinned to ten consecutive pixels. The rest of the legend is the same as in Fig. 1. |
The polarized spectra are much more interesting to consider. First, we see that the polarized flux shows a blueing trend, influenced by the strongly wavelength-dependent continuum and linear (debiased) polarization degree that increases from almost 0% at 8500 Å to 0.8% at 4500 Å. This trend is confirmed by a rotation of the polarization position angle with wavelength too, from about 45° in the red to 0° in the blue. The continuous rotation of θ between the two extremes of our spectrum points to the presence of two distinct, but superimposed, polaro-genesis components. The rise in Pd toward the blue, coupled to the the apparently high extinction along the line-of-sight (Ward et al. 1980), advocates for dichroism absorption as the main polarization mechanism, coupled to a weaker scattering component, most likely on the NLR, as explained below. The variability in θ is then directly related to the wavelength-dependent importance of each component.
The overall debiased polarization integrated over the full waveband (0.24% ± 0.1% at 0.6° ± 0.3°) is a crude approximation, as it does not reflect the strong wavelength dependence of Pd in NGC 7582. For this reason, we integrated the polarization degree and angle in two synthetic Kron-Cousins broad band filters: V (central wavelength 5500 Å, spectral width 890 Å) and R (central wavelength 6500 Å, spectral width 1000 Å), which translates to PV = 0.46% ± 0.1% at 0.3° ± 0.8° and PR = 0.22% ± 0.1% at 1.9° ± 1.3°. The V- and R-band debiased polarizations are significantly higher than the instrumental polarization and the ISP (see Table 2), indicating that the observed polarization is predominantly originating from the AGN itself, although it is certainly diluted by the host starlight. Compared to the radio position angle of ≈150°, as measured on a 20 cm radio map by Ward et al. (1980) and Ulvestad & Wilson (1984), further confirmed by the ATCA 6 cm image taken by (Forbes & Norris 1998), the red part of the polarized spectrum tend to show some orthogonality, as expected from type-2 AGNs (Antonucci 1993). Because of the wavelength dependence of Pd (and because past polarimetric data of this source were only obtained in broadband filters), it is difficult to compare our results to archival data. At least, the wavelength-dependence of Pd was already noted by Brindle et al. (1990), who measured a B-band polarization of 1.35% ± 0.25% and a V-band polarization of 0.67% ± 0.10%, which are rather close to our values. Martin et al. (1983) reported a 1.03% ± 0.12% polarization over the 3800–5600 Å waveband.
It is truly remarkable, in fact, to take note of the strong emission lines seen in polarization. They do not correspond to the usual Balmer lines, but to the [OIII], [N II] and [S II] emission doublets instead. They are polarized above the linear continuum, but they show the same polarization angle as the adjacent spectral bins. Focusing on the brightest emission line detected in the polarized flux (the [N II] doublet), we see that its intrinsic debiased polarization is about 0.32%; whereas the adjacent continuum is polarized at ∼0.15%. This is unusual, as narrow emission lines are resulting from photo-ionization of a low-density, extended medium that is generally thought to produce negligible intrinsic polarization (Smith et al. 2002). To produce a polarization higher than that of the continuum, part of the NLR must be obscured, so that that the narrow line polarization is the result of NLR emission scattering outside the obscuring region. Marin et al. (2025a) have shown that Centaurus A shares similar features and concluded that the base of the NLR must be hidden by a torus that is larger than usual. Another example is NGC 4258, as observed by Wilkes et al. (1995) and Barth et al. (1999), for which a similar explanation was found. NGC 7582 likely belongs to this new class of partially hidden-NLR AGNs (Marin et al. 2025a).
3.5. NGC 7603
NGC 7603 is the last of the five CLAGNs observed during our campaign. Its total flux spectrum is shown in Fig. 5 (top-left). The presence of broad emission lines superimposed on a blue continuum is ubiquitous, especially at the location of Hβ. The Hα line appears asymmetric. Lorentzian fitting indicates a single-peaked, blueshifted Hβ line with FWHM on the order of 3600 km s−1. Two broad components are required to fit the Hα line: one redshifted and one blueshifted, with the former having a FWHM of ∼ 2500 km s−1 and 4400 km s−1 for the latter (see Table 3). Thus, the AGN remains in its type-1 state.
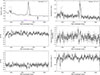 |
Fig. 5. VLT/FORS2 spectropolarimetry of the CLAGN NGC 7603. Except for the total flux panel, the spectra were rebinned to ten consecutive pixels. The rest of the legend is the same as in Fig. 1. |
The polarized flux spectrum confirms the fit achieved in total flux: two individual broad Hα lines appear clearly separated due to their respective velocity shifts. The Hβ line, even if it is less prominent, is also discernible in polarized flux. The FWHMs of the broad polarized lines are comparable to their total flux analogs, within uncertainties. The associated debiased polarization degree is low, 0.45% ± 0.1% integrated over the whole waveband and appears wavelength-independent. It is substantially higher than the instrumental polarization and the ISP observed toward this object (see Table 2), leading us to conclude that we are indeed observing the intrinsic polarization of the AGN, even if it is diluted by the light from the host galaxy. The associated polarization angle is 150.5° ± 0.9° on average; namely, it is parallel to the faint south-east radio extension that highlight the jet position angle in the radio map presented by Lal et al. (2004). In their 5 GHz VLA maps, the radio structure is indeed seen to extend along a position angle of ≈155°. Such an alignment is in line with the prediction of the standard unified model for Seyfert-1 AGNs (Antonucci 1993).
Compared to historical measurements (Marin et al. 2019), NGC 7603 appears relatively stable. In 1976, the 3800–5600 Å polarization of the source was 0.32% ± 0.28% at 127.0° ± 27.0° in a 4″ aperture (Martin et al. 1983). In 1987, Goodrich (1989) measured a 4415–7186 Å polarization of 0.42% ± 0.03% at 128.9° ± 1.8° using a 2.1″ × 5″ (or 2.1″ × 7″, it is unclear) slit. Smith et al. (2002) recorded a 6500–6980 Å polarization of 0.25% ± 0.04% at 132.7° ± 1.8° using a 1.2″ slit width. Finally, a measurement of P = 0.42% ± 0.06% at θ = 154° ± 5° was obtained in April 2019 using the Intermediate-dispersion Spectrograph and Imaging System (ISIS) mounted at the f/11 Cassegrain focus of the 4.2 m William Herschel Telescope (Agís-González et al., in prep.). Within the error bars and the variable observing conditions, the continuum polarization of NGC 7603 appears unchanged for half a century.
4. Discussion
We go on to further analyze our modest spectropolarimetric sample of CLAGNs. First, we report in Table 4 the waveband-integrated debiased polarization degree and angle of each source, then compare them to the ISP. It becomes clear that both NGC 1346 and NGC 2617 are ISP-dominated, so their continuum polarization cannot be trusted. Even subtracting the dichroic component by fitting a Serkowski’s law on Q and U (separately) does not provide more insightful information, as ISP clearly dominates the continuum. We can scarcely glimpse a continuum that appears to be wavelength-independent in both AGNs. IRAS 23226-3843 and NGC 7603 are above the ISP by a comfortable margin, so we can better analyze them. For the first AGN, the linear polarization continuum appears wavelength-dependent, while the second is achromatic within the uncertainties. The case of NGC 7582 is similar to that of IRAS 23226-3843, but its wavelength-dependent polarization is even more pronounced, sharply rising in the blue. The gray polarization degree of NGC 1346, NGC 2617 and NGC 7603 advocates, at first order, for electron-scattering; whereas the strong rise of Pd in the blue band, a key signature of dust reprocessing by small grains (Kartje 1995), advocates for Mie scattering for the other two AGNs. This, in fact, is coherent with the proposed dust origin of the strong polarization in NGC 7582’s narrow lines (see Sect. 3.4).
Polarization of our CLAGNs.
In Table 5, we summarize the current spectral classification of each of our five CLAGNs. IRAS 23226-3843, which was previously classified as a type-2 AGN by Kollatschny et al. (2023) in 2020, now shows unequivocally broad emission lines in both Hα and Hβ. A single broad Lorentzian is enough to fit the Hβ feature but three broad lines, in addition to the usual central narrow line, are required to fit the Hα feature. The same applies to NGC 1346, an AGN classified as a type-2 source in 2018 by Senarath et al. (2019), which now shows broad Balmer lines, with the subtlety that the August spectrum reveals only a broad Hβ line. Meanwhile, the September spectrum has both the Balmer lines with FWHMs on the order of 2000 km s−1. Our observation certainly caught the AGN during a transition period. NGC 2617, classified as a type-1.8 object in 2022 by Oknyansky et al. (2023) because of the lack of a broad Hβ component and very shallow broad Hα wings, also recovered from this status. Both lines have FWHMs superior to 2000 km s−1, the Hα line even showing a double-peaked structure. This feature, however, could not be observed in polarized flux as the source is ISP-dominated. NGC 7582, a type-2 Seyfert galaxy in 2016 according to Lefkir et al. (2023), did not change its classification. Finally, NGC 7603, another AGN that stayed for decades in a type-1 state but occasionally showed type-1.8 phases, also retained its type-1 spectral classification. Similarly to IRAS 23226-3843 and NGC 2617, a single broad Hβ component and a double-peaked Hα line have appeared but, in addition compared to the aforementioned AGNs, these features appear very clearly in the polarized flux spectrum thanks to the good observation statistics. In total, over the five CLAGNs observed in our campaign, three show an indisputable change of look since their last spectral classification and two retained their spectral classification.
Current and most recent past spectral type classification of our CLAGNs.
For all of those four CLAGNs, that are now belonging to the type-1 class, double-peaked structures are revealed in their broad-line total flux profiles after spectral decomposition (see Table 3), three times in the Hα line and once in the Hβ line. In polarized fluxes, double-peaked Hα lines are reliably detected for at least two AGNs. All broad Hβ features are systematically blueshifted, while there is are no favorite velocity shift “direction” for the Hα lines. It tends to suggest that double-peaked broad lines are rather common in the “turned-on” state of CLAGNs, hinting toward the idea that the BLR is not simply reappearing, but reappearing in a kinematically disturbed, disk-dominated configuration, possibly linked to (1) a temporarily enhanced accretion episode (Noda & Done 2018); (2) fast rearrangement of the BLR geometry (Rodríguez-Pascual et al. 1997); or (3) a preferential illumination of the near side of the disk (explaining systematic Hβ blueshifts, Goosmann et al. 2014). The consistent blueshift of Hβ further hints at a stratified or radius-dependent BLR response as the ionizing continuum increases. This strongly support the idea that transitioning CLAGNs are predominantly accretion-driven.
5. Conclusion
We have observed, for the first time, a modest sample of five CLAGNs in spectropolarimetry. From object-to-object, our conclusion are as follows:
-
IRAS 23226–3843. Spectroscopy reveals a re-emerging BLR, with blueshifted Balmer lines of moderate width and clear double-peaked Hα emission after spectral decomposition, characteristic of line emission in a disk. Polarization shows a low but significant debiased intrinsic continuum polarization (∼0.6% after host correction), with a mild wavelength dependence. The polarized flux also exhibits a double-peaked Hα profile, indicating subsequent scattering of the broad-line emission. The location of this reflector cannot be determined due to the absence of radio structure to compare the polarization angle to.
-
NGC 1346. Spectroscopically, the source transitioned within a month from a type-2–like appearance to a type-1 state, showing the emergence of broad, blueshifted Hα and Hβ components. Debiased polarization is intrinsically very low (≤0.15% after ISP correction), so the source lacks a significant polarization detection. If trustworthy, P is potentially wavelength-independent, consistent with electron scattering within a type-1 geometry.
-
NGC 2617. The total flux spectrum displays strong, broad Balmer lines with moderate blueshifts, confirming that the object is in a type-1 state, in disagreement with recent monitoring campaigns that classified the source as a type-1.5 AGN. The observed debiased polarization degree is extremely low (0.11%), likely dominated by interstellar polarization and basically undetected.
-
NGC 7582. From a spectroscopic point of view, the AGN remains in a narrow-line (type-2) state with no broad Balmer emission in total flux. Polarimetry reveals a significant wavelength-dependent debiased continuum polarization (0–0.8% from red to blue), with a rotation of θ, no broad lines in polarized flux, and (most strikingly) forbidden lines ([O III], [N II], and [S II]) that are more highly polarized than their adjacent continuum. This behavior indicates a partially obscured NLR, consistent with a “hidden-NLR” configuration (Marin et al. 2025a).
-
NGC 7603. The total flux spectrum shows strong broad Balmer lines, including a double-component Hα. Polarized flux cleanly reproduces the dual Hα components, confirming their intrinsic nature. The debiased continuum polarization (∼0.4%) is wavelength-independent and aligned with the radio jet axis, fully consistent with a regular type-1 classification. A comparison with historical data indicates that its polarization has remained unchanged for nearly 50 years.
One of the most important discoveries is that three out of the five AGNs have undergone a clear spectral transition, compared to their previous classification in the literature (IRAS 23226–3843, NGC 1346, NGC 2617). The AGNs that have “changed in look” have transitioned toward the type-1 side, each now displaying broad Balmer lines with FWHMs ≥ 2000 km s−1. This is a very high transition rate for a sample that was only selected based on the absence of past spectropolarimetric data for each source. It tends to suggest that changing-look events are not that rare among low-luminosity AGNs, but the low rate of periodic AGN measurements in spectroscopy (and even more so in spectropolarimetry) hinders us from accurately probing the true cadence of appearance and disappearance of broad emission lines. We also note that most CLAGNs in their turned-on state exhibit a reactivated (or strengthened) BLR emission and disturbed, disk-dominated BLR kinematics (as probed by the high frequency of double peaks and the systematic blueshift of the Hβ lines). Their observed low, debiased, intrinsic polarization is consistent with direct AGN views and electron scattering is clearly the dominant polarization mechanism for most of the sources.
In summary, the polarized data acquired with our modest spectropolarimetric sample provide a model-independent view of the inner geometry of CLAGNs and support an accretion-driven origin as the primary mechanism behind the observed changing-look transitions. These observations demonstrate that optical spectropolarimetry is a particularly effective diagnostic tool for identifying the physical mechanisms underlying these appearance changes. These findings motivate further polarimetric monitoring of these sources to improve our understanding of the interplay between the accretion flow, the BLR, and the inner parsec of AGNs.
Acknowledgments
The authors would like to thank the anonymous referee for her/his comments. FM and JB acknowledge financial support from the french national space agency (CNES) and the Centre national de la recherche scientifique (CNRS) Action Thématique Phénomènes Extrêmes et Multi-messagers (AT-PEM). DH is research director at the F.R.S-FNRS, Belgium.
References
- Allen, D. A., Norris, R. P., Meadows, V. S., & Roche, P. F. 1991, MNRAS, 248, 528 [NASA ADS] [CrossRef] [Google Scholar]
- Alloin, D., Pelat, D., Phillips, M., & Whittle, M. 1985, ApJ, 288, 205 [NASA ADS] [CrossRef] [Google Scholar]
- Antonucci, R. 1993, ARA&A, 31, 473 [Google Scholar]
- Aretxaga, I., Joguet, B., Kunth, D., Melnick, J., & Terlevich, R. J. 1999, ApJ, 519, L123 [NASA ADS] [CrossRef] [Google Scholar]
- Arp, H. 1971, Astrophys. Lett., 7, 221 [NASA ADS] [Google Scholar]
- Arp, H. 1980, ApJ, 239, 469 [Google Scholar]
- Barth, A. J., Tran, H. D., Brotherton, M. S., et al. 1999, AJ, 118, 1609 [NASA ADS] [CrossRef] [Google Scholar]
- Blanchard, P. K., Nicholl, M., Berger, E., et al. 2017, ApJ, 843, 106 [Google Scholar]
- Brindle, C., Hough, J. H., Bailey, J. A., et al. 1990, MNRAS, 244, 577 [NASA ADS] [Google Scholar]
- Campana, S., Mainetti, D., Colpi, M., et al. 2015, A&A, 581, A17 [NASA ADS] [CrossRef] [EDP Sciences] [Google Scholar]
- Cikota, A., Patat, F., Cikota, S., & Faran, T. 2017, MNRAS, 464, 4146 [Google Scholar]
- Condon, J. J., Cotton, W. D., Greisen, E. W., et al. 1998, AJ, 115, 1693 [Google Scholar]
- Corbett, E. A., Robinson, A., Axon, D. J., & Young, S. 2000, MNRAS, 319, 685 [Google Scholar]
- Dong, Q., Zhang, Z.-X., Gu, W.-M., Sun, M., & Zheng, Y.-G. 2025, ApJ, 986, 160 [Google Scholar]
- Dopita, M. A., Shastri, P., Scharwächter, J., et al. 2015, IAU Symp., 309, 200 [Google Scholar]
- Forbes, D. A., & Norris, R. P. 1998, MNRAS, 300, 757 [Google Scholar]
- Fossati, L., Bagnulo, S., Mason, E., & Landi Degl’Innocenti, E. 2007, ASP Conf. Ser., 364, 503 [NASA ADS] [Google Scholar]
- Giustini, M., Costantini, E., De Marco, B., et al. 2017, A&A, 597, A66 [NASA ADS] [CrossRef] [EDP Sciences] [Google Scholar]
- Goodrich, R. W. 1989, ApJ, 340, 190 [NASA ADS] [CrossRef] [Google Scholar]
- Goosmann, R. W., Gaskell, C. M., & Marin, F. 2014, Adv. Space Res., 54, 1341 [NASA ADS] [CrossRef] [Google Scholar]
- Heckman, T. M., Miley, G. K., van Breugel, W. J. M., & Butcher, H. R. 1981, ApJ, 247, 403 [NASA ADS] [CrossRef] [Google Scholar]
- Heisler, C. A., Lumsden, S. L., & Bailey, J. A. 1997, Nature, 385, 700 [Google Scholar]
- Hutsemékers, D., Agís González, B., Sluse, D., Ramos Almeida, C., & Acosta Pulido, J.-A. 2017, A&A, 604, L3 [NASA ADS] [CrossRef] [EDP Sciences] [Google Scholar]
- Hutsemékers, D., Agís González, B., Marin, F., et al. 2019, A&A, 625, A54 [NASA ADS] [CrossRef] [EDP Sciences] [Google Scholar]
- Hutsemékers, D., Agís González, B., Marin, F., & Sluse, D. 2020, A&A, 644, L5 [NASA ADS] [CrossRef] [EDP Sciences] [Google Scholar]
- Izzo, C., de Bilbao, d. B., & Larsen, J. 2019, FORS Pipeline User Manual, VLT-MAN-ESO-19500-4106 [Google Scholar]
- Jana, A., Ricci, C., Temple, M. J., et al. 2025, A&A, 693, A35 [NASA ADS] [CrossRef] [EDP Sciences] [Google Scholar]
- Jones, D. H., Read, M. A., Saunders, W., et al. 2009, MNRAS, 399, 683 [Google Scholar]
- Kartje, J. F. 1995, ApJ, 452, 565 [Google Scholar]
- Kollatschny, W., & Zetzl, M. 2013, A&A, 549, A100 [NASA ADS] [CrossRef] [EDP Sciences] [Google Scholar]
- Kollatschny, W., Grupe, D., Parker, M. L., et al. 2023, A&A, 670, A103 [NASA ADS] [CrossRef] [EDP Sciences] [Google Scholar]
- Komossa, S., Grupe, D., Marziani, P., et al. 2024, arXiv e-prints [arXiv:2408.00089] [Google Scholar]
- Koss, M. J., Ricci, C., Trakhtenbrot, B., et al. 2022, ApJS, 261, 2 [NASA ADS] [CrossRef] [Google Scholar]
- Lal, D. V., Shastri, P., & Gabuzda, D. C. 2004, A&A, 425, 99 [NASA ADS] [CrossRef] [EDP Sciences] [Google Scholar]
- Landt, H., Bentz, M. C., Ward, M. J., et al. 2008, ApJS, 174, 282 [NASA ADS] [CrossRef] [Google Scholar]
- Lee, H.-W. 2011, J. Korean Astron. Soc., 44, 59 [Google Scholar]
- Lefkir, M., Kammoun, E., Barret, D., et al. 2023, MNRAS, 522, 1169 [Google Scholar]
- Marin, F. 2014, MNRAS, 441, 551 [NASA ADS] [CrossRef] [Google Scholar]
- Marin, F. 2017, A&A, 607, A40 [NASA ADS] [CrossRef] [EDP Sciences] [Google Scholar]
- Marin, F., Porquet, D., Goosmann, R. W., et al. 2013, MNRAS, 436, 1615 [CrossRef] [Google Scholar]
- Marin, F., Hutsemékers, D., & Agís González, B. 2019, in SF2A-2019: Proceedings of the Annual Meeting of the French Society of Astronomy and Astrophysics, eds. P. Di Matteo, O. Creevey, A. Crida, et al., 509 [Google Scholar]
- Marin, F., Hutsemékers, D., Jiang, C.-Z., et al. 2025a, A&A, 695, A55 [NASA ADS] [CrossRef] [EDP Sciences] [Google Scholar]
- Marin, F., Hutsemékers, D., & Jorstad, S. 2025b, A&A, 700, A206 [NASA ADS] [CrossRef] [EDP Sciences] [Google Scholar]
- Martin, P. G., Thompson, I. B., Maza, J., & Angel, J. R. P. 1983, ApJ, 266, 470 [CrossRef] [Google Scholar]
- Marziani, P., del Olmo, A., Perea, J., D’Onofrio, M., & Panda, S. 2020, Atoms, 8, 94 [NASA ADS] [CrossRef] [Google Scholar]
- Moran, E. C., Halpern, J. P., & Helfand, D. J. 1996, ApJS, 106, 341 [NASA ADS] [CrossRef] [Google Scholar]
- Noda, H., & Done, C. 2018, MNRAS, 480, 3898 [Google Scholar]
- Oknyansky, V. L., Gaskell, C. M., Huseynov, N. A., et al. 2017, MNRAS, 467, 1496 [NASA ADS] [Google Scholar]
- Oknyansky, V. L., Brotherton, M. S., Tsygankov, S. S., et al. 2023, MNRAS, 525, 2571 [Google Scholar]
- Oknyansky, V. L., Brotherton, M. S., Tsygankov, S. S., et al. 2025, MNRAS, 536, 2089 [Google Scholar]
- Osterbrock, D. E. 1977, ApJ, 215, 733 [Google Scholar]
- Panopoulou, G. V., Markopoulioti, L., Bouzelou, F., et al. 2025, ApJS, 276, 15 [NASA ADS] [CrossRef] [Google Scholar]
- Peterson, B. M. 2006, in Physics of Active Galactic Nuclei at all Scales, ed. D. Alloin, 693, 77 [NASA ADS] [CrossRef] [Google Scholar]
- Ricci, C., & Trakhtenbrot, B. 2023, Nat. Astron., 7, 1282 [Google Scholar]
- Risaliti, G., Elvis, M., Fabbiano, G., Baldi, A., & Zezas, A. 2005, ApJ, 623, L93 [Google Scholar]
- Rodríguez-Pascual, P. M., Alloin, D., Clavel, J., et al. 1997, ApJS, 110, 9 [CrossRef] [Google Scholar]
- Senarath, M. R., Brown, M. J. I., Cluver, M. E., Jarrett, T. H., & Ross, N. P. 2019, Res. Notes AAS, 3, 62 [Google Scholar]
- Senarath, M. R., Brown, M. J. I., Cluver, M. E., et al. 2021, MNRAS, 503, 2583 [NASA ADS] [CrossRef] [Google Scholar]
- Serkowski, K., Mathewson, D. S., & Ford, V. L. 1975, ApJ, 196, 261 [NASA ADS] [CrossRef] [Google Scholar]
- Seyfert, C. K. 1943, ApJ, 97, 28 [NASA ADS] [CrossRef] [Google Scholar]
- Shappee, B. J., Prieto, J. L., Grupe, D., et al. 2014, ApJ, 788, 48 [Google Scholar]
- Simmons, J. F. L., & Stewart, B. G. 1985, A&A, 142, 100 [NASA ADS] [Google Scholar]
- Smith, J. E., Young, S., Robinson, A., et al. 2002, MNRAS, 335, 773 [NASA ADS] [CrossRef] [Google Scholar]
- Tohline, J. E., & Osterbrock, D. E. 1976, ApJ, 210, L117 [Google Scholar]
- Ulvestad, J. S., & Wilson, A. S. 1984, ApJ, 285, 439 [Google Scholar]
- van Dokkum, P. G. 2001, PASP, 113, 1420 [Google Scholar]
- van Dokkum, P. G., Bloom, J., & Tewes, M. 2012, Astrophysics Source Code Library [record ascl:1207.005] [Google Scholar]
- Véron-Cetty, M. P., & Véron, P. 2003, A&A, 412, 399 [NASA ADS] [CrossRef] [EDP Sciences] [Google Scholar]
- Ward, M., Penston, M. V., Blades, J. C., & Turtle, A. J. 1980, MNRAS, 193, 563 [NASA ADS] [CrossRef] [Google Scholar]
- Wilkes, B. J., Schmidt, G. D., Smith, P. S., Mathur, S., & McLeod, K. K. 1995, ApJ, 455, L13 [NASA ADS] [Google Scholar]
- Wills, B. J., Wills, D., & Breger, M. 2011, ApJS, 194, 19 [NASA ADS] [CrossRef] [Google Scholar]
- Yang, J., Paragi, Z., Beswick, R. J., et al. 2021, MNRAS, 503, 3886 [Google Scholar]
Appendix A: Fitting results
To analyze the line profiles and measure their FWHM, we carried out spectral decompositions of the optical spectra in the region around the Hα and Hβ emission features. The continuum emission spectral shape was estimated first and it was modeled by fitting a power-law function to the spectra shortward and longward of the strong emission lines, taking care to avoid their potentially extended wings. After estimating the continuum contribution, each emission line profile was modeled as the sum of their individual line components. Each emission line detected in the profile was fitted with a Lorentzian function, characterized by its central wavelength, intensity, and FWHM.
In the Hα region, the model includes a Hα component, the [N II] λλ6548,6583 doublet, and Fe II emission when detected. In the Hβ region, the model consists of a Hβ component, the [O III] λλ4959,5007 doublet, and additional emission lines (e.g. Fe II, Fe IV, Fe VII) when detected. Additional broad Hα or Hβ component were included when required to account for asymmetric or extended line wings. The total emission line model is obtained by summing all individual Lorentzian components. During the emission line fitting process, the continuum is not considered as a free parameters. The model parameters were optimized by minimizing the difference between the observed spectrum and the model following a χ2 minimization approach. The fitting procedure simultaneously adjusts the line central wavelength, intensities, and FWHM of all emission components in the profile.
The parameter uncertainties were estimated by repeatedly perturbing the observed spectrum according to its errors and refitting the model. This procedure is equivalent to a Monte Carlo error propagation. The fitting procedure was repeated 100 times, each time perturbing the observed spectrum within its measurement uncertainties. Random Gaussian noise consistent with the flux uncertainties was added to the observed flux, and small random shifts were applied to the wavelength grid within half a spectral bin to account for sampling effects. By doing so, the model parameters are optimized to minimize the squared residual between the observed spectrum and the model. The spectral best-fit of the Hα and Hβ region are shown by the red line in Figs. A.1–A.6, and the best fit FWHM obtains for the Hα and Hβ component are displays in Table 3. The quality of the fit was assessed by inspecting the residuals, defined as the difference between the observed flux and the best-fitting model. The residuals are shown in the lower panel of each figure.
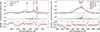 |
Fig. A.1. Best fit model of the spectroscopic observation of IRAS 23226-3843. The original spectrum is shown using a solid black line, the underlying power-law continuum appears using a dashed black line and the model, that includes the most prominent narrow emission lines and – potentially – broad Balmer lines (highlighted using various colors), is shown in red. The characteristics of the broad Lorentzian profiles used to fit the data are listed in Table 3. On the left is the best-fit model for the Hβ line, while the Hα line model is shown on the right. The bottom panels present the residuals (observed spectrum minus the model) for each of the two regions. |
All Tables
All Figures
|
Fig. 1. VLT/FORS2 spectropolarimetry of the CLAGN IRAS 23226-3843. The top-left figure shows the total flux spectrum (in arbitrary units). The most prominent telluric absorption lines are indicated in purple. The middle- and bottom-left figures present the Q/I and U/I normalized Stokes parameters. The top-right panel shows the polarized flux, that is the multiplication of the total flux with the polarization degree. The middle-right panel presents the debiased linear polarization degree while the bottom-right panel shows the polarization position angle. Except for the total flux panel, spectra were rebinned to 10 consecutive pixels. 1σ observational errors are indicated for each spectral bin, as well as the main, prominent, broad, and narrow emission lines. |
| In the text | |
|
Fig. 2. VLT/FORS2 spectropolarimetry of the CLAGN NGC 1346. Two observations, taken nearly a month apart, are shown. Except for the total flux panel, spectra were rebinned to 40 consecutive pixels. The rest of the legend is the same as Fig. 1. |
| In the text | |
|
Fig. 3. VLT/FORS2 spectropolarimetry of the CLAGN NGC 2617. Except for the total flux panel, spectra were rebinned to 70 consecutive pixels. The rest of the legend is the same as in Fig. 1. |
| In the text | |
|
Fig. 4. VLT/FORS2 spectropolarimetry of the CLAGN NGC 7582. Except for the total flux panel, spectra were rebinned to ten consecutive pixels. The rest of the legend is the same as in Fig. 1. |
| In the text | |
|
Fig. 5. VLT/FORS2 spectropolarimetry of the CLAGN NGC 7603. Except for the total flux panel, the spectra were rebinned to ten consecutive pixels. The rest of the legend is the same as in Fig. 1. |
| In the text | |
|
Fig. A.1. Best fit model of the spectroscopic observation of IRAS 23226-3843. The original spectrum is shown using a solid black line, the underlying power-law continuum appears using a dashed black line and the model, that includes the most prominent narrow emission lines and – potentially – broad Balmer lines (highlighted using various colors), is shown in red. The characteristics of the broad Lorentzian profiles used to fit the data are listed in Table 3. On the left is the best-fit model for the Hβ line, while the Hα line model is shown on the right. The bottom panels present the residuals (observed spectrum minus the model) for each of the two regions. |
| In the text | |
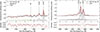 |
Fig. A.2. Same as Fig. A.1, but for NGC 1346 (August observation). |
| In the text | |
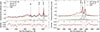 |
Fig. A.3. Same as Fig. A.1 but for NGC 1346 (September observation). |
| In the text | |
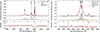 |
Fig. A.4. Same as Fig. A.1, but for NGC 2617. |
| In the text | |
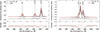 |
Fig. A.5. Same as Fig. A.1, but for NGC 7582. |
| In the text | |
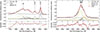 |
Fig. A.6. Same as Fig. A.1, but for NGC 7603. |
| In the text | |
Current usage metrics show cumulative count of Article Views (full-text article views including HTML views, PDF and ePub downloads, according to the available data) and Abstracts Views on Vision4Press platform.
Data correspond to usage on the plateform after 2015. The current usage metrics is available 48-96 hours after online publication and is updated daily on week days.
Initial download of the metrics may take a while.