Fig. 4
Download original image
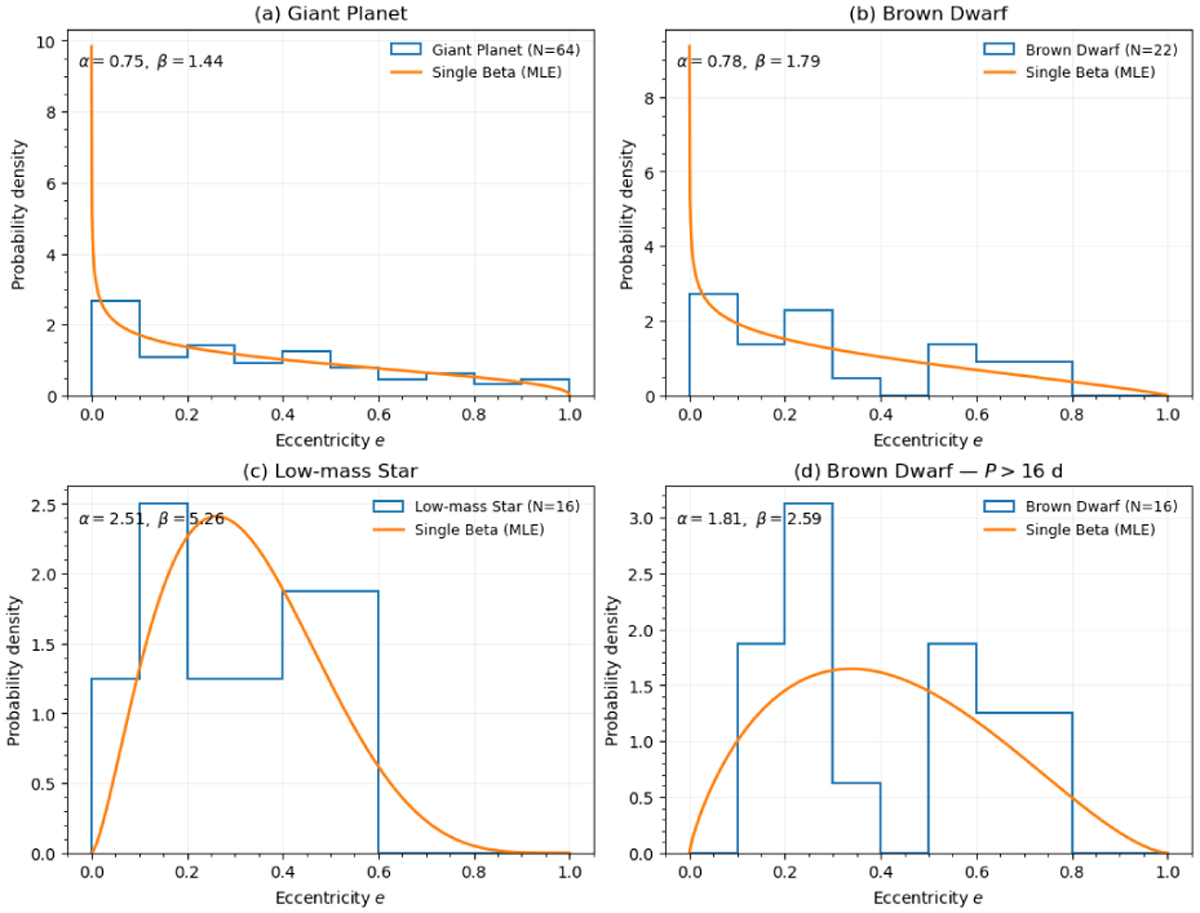
Eccentricity distributions for (a) GTPs, (b) all transiting BDs (P > 10 d), (c) LMS companions, and (d) the BD subsample with P > 16 d. Step histograms use uniform bins in e; solid curves show the single-Beta maximum-likelihood fit to each panel (annotated by (α, β)). Sample sizes are indicated in the legends. BDs (P > 16 d) resemble LMSs more than GTPs, with a higher, more concentrated mid-e preference, whereas the all-BDs distribution is pulled toward the GTP-like shape by the short-period, low-e objects. This visual comparison complements our statistical results (ES permutation p = 0.016 for GTP vs. BD(> 16 d); non-separation of BD(> 16 d) from LMS at current N).
Current usage metrics show cumulative count of Article Views (full-text article views including HTML views, PDF and ePub downloads, according to the available data) and Abstracts Views on Vision4Press platform.
Data correspond to usage on the plateform after 2015. The current usage metrics is available 48-96 hours after online publication and is updated daily on week days.
Initial download of the metrics may take a while.