Open Access
Fig. 2
Download original image
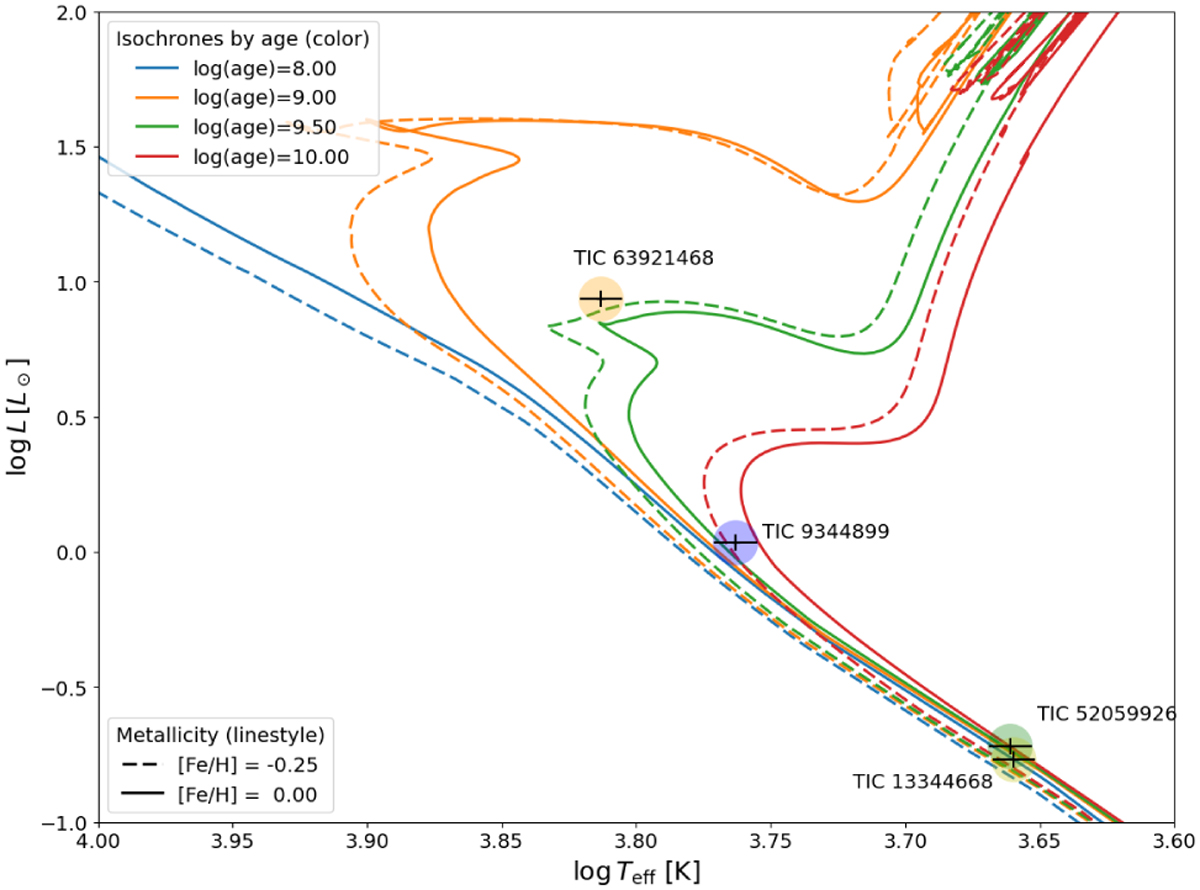
Luminosity vs. effective temperature for the stars in our sample. Curves represent MIST isochrones for ages 0.1 Gyr (blue), 1.0 Gyr (orange), 3 Gyr (green), and 10.0 Gyr (yellow). Different line types represent different metallicities. The red point represents the positions of stars with their error bars.
Current usage metrics show cumulative count of Article Views (full-text article views including HTML views, PDF and ePub downloads, according to the available data) and Abstracts Views on Vision4Press platform.
Data correspond to usage on the plateform after 2015. The current usage metrics is available 48-96 hours after online publication and is updated daily on week days.
Initial download of the metrics may take a while.