Open Access
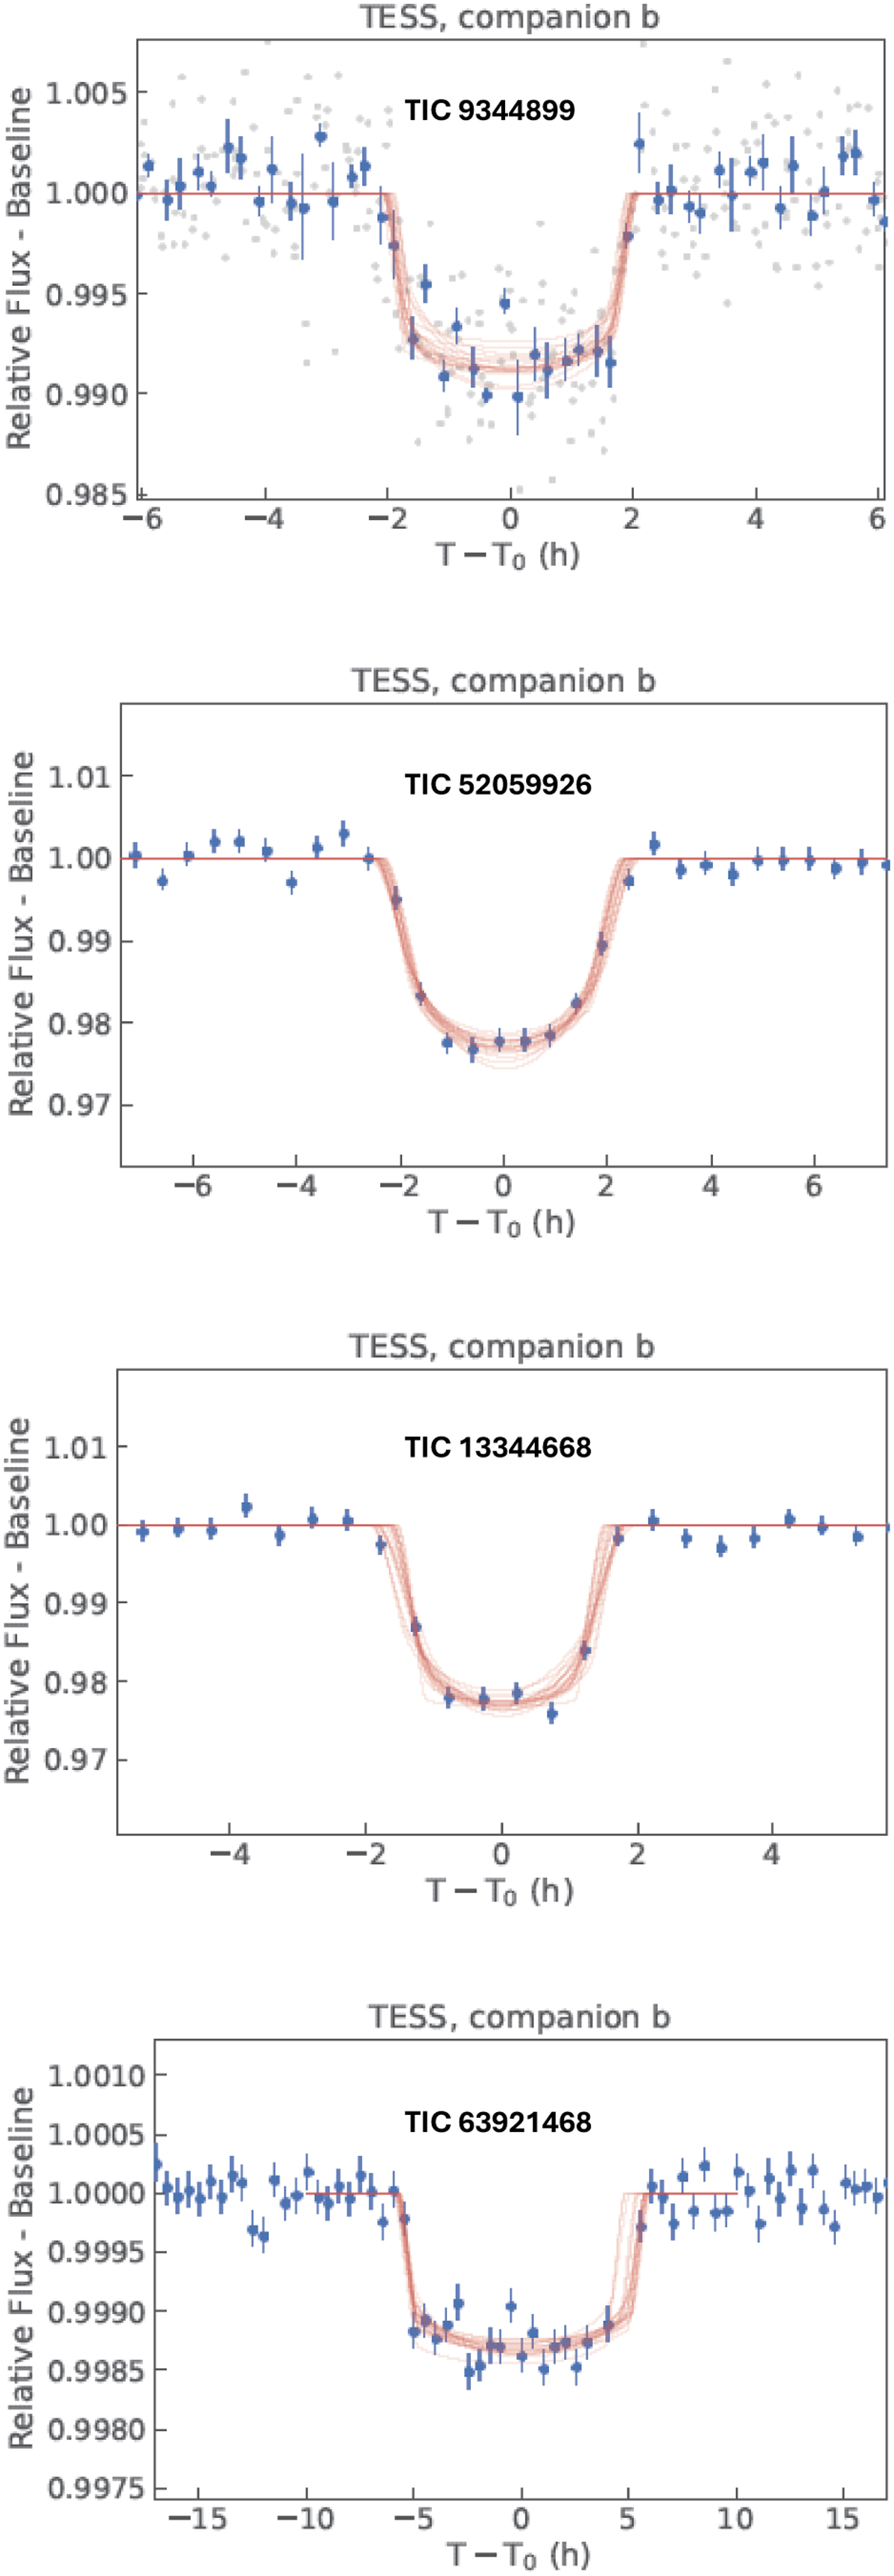
Fig. A.6
Download original image
Phased LCs fitted with allesfitter as described in Section 3.3. The gray points represent TESS data, and the blue points are TESS binned data in the phase curve with a bin width of 24 minutes in phase. The red lines represent the best transit models.
Current usage metrics show cumulative count of Article Views (full-text article views including HTML views, PDF and ePub downloads, according to the available data) and Abstracts Views on Vision4Press platform.
Data correspond to usage on the plateform after 2015. The current usage metrics is available 48-96 hours after online publication and is updated daily on week days.
Initial download of the metrics may take a while.