Open Access
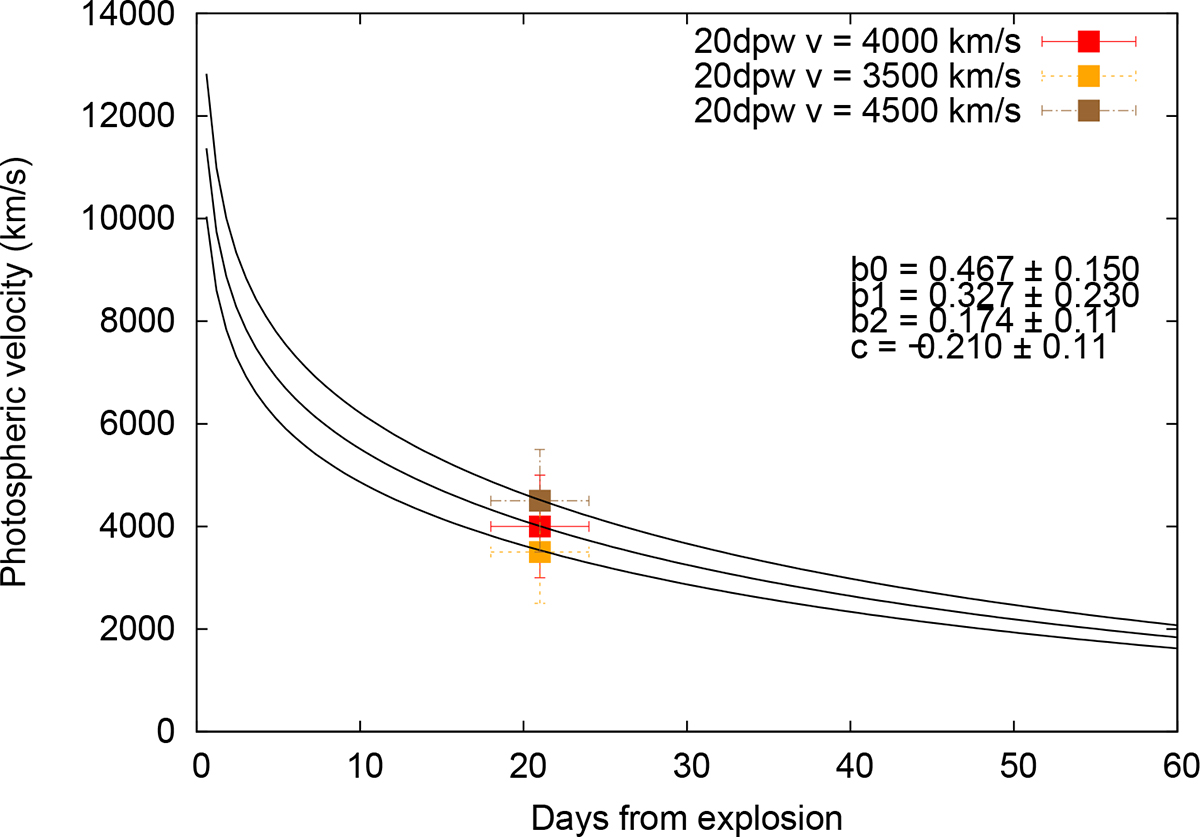
Fig. 6.
Download original image
Fitting the empirical formula of Takáts & Vinkó (2012) (Eq. 5) to the measured photospheric velocity (4000 km s−1) of SN 2020dpw (red dot). The orange and brown markers represent the 3500 and 4500 km s−1 test points, which were used to estimate the uncertainty of the v50 value.
Current usage metrics show cumulative count of Article Views (full-text article views including HTML views, PDF and ePub downloads, according to the available data) and Abstracts Views on Vision4Press platform.
Data correspond to usage on the plateform after 2015. The current usage metrics is available 48-96 hours after online publication and is updated daily on week days.
Initial download of the metrics may take a while.