Open Access
Fig. 4.
Download original image
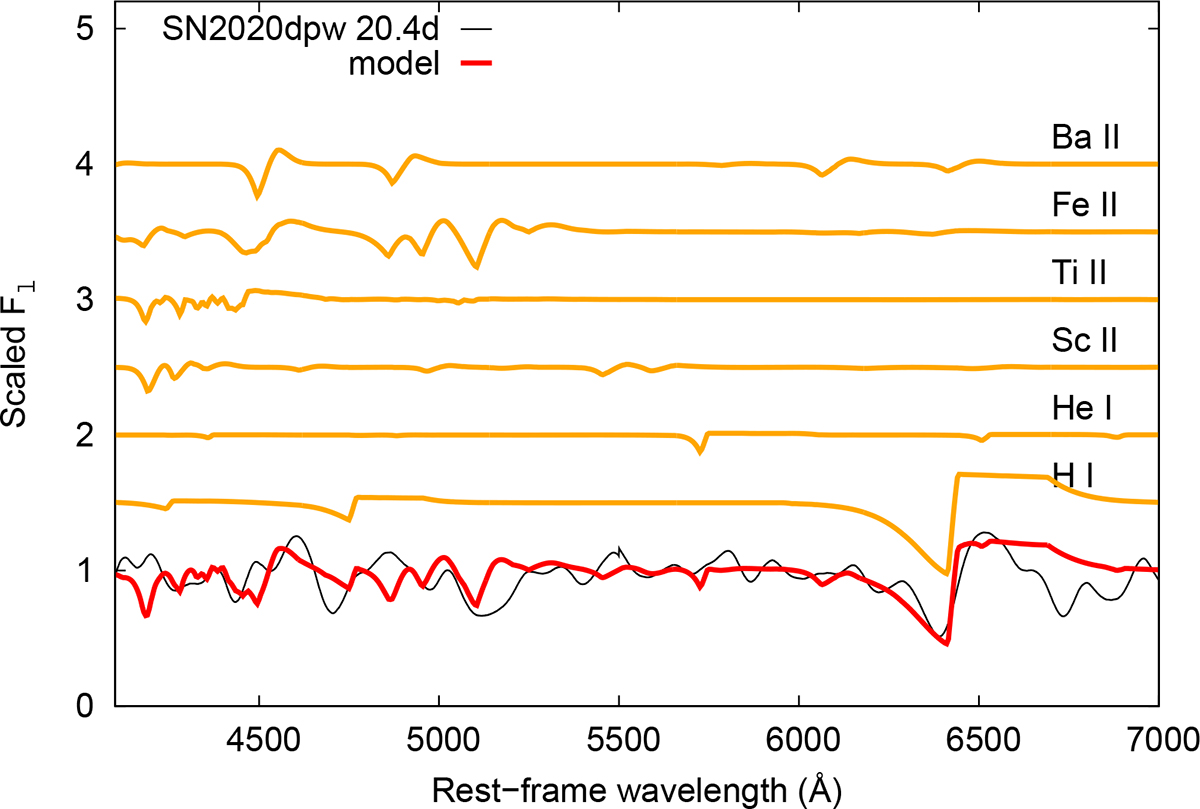
Continuum-normalized, redshift- and extinction-corrected spectrum of SN 2020dpw taken at 21d phase post-explosion (black) and its best-fit model obtained in SYN++ (red). The contribution of each identified ion is plotted in orange, and is shifted vertically for clarity.
Current usage metrics show cumulative count of Article Views (full-text article views including HTML views, PDF and ePub downloads, according to the available data) and Abstracts Views on Vision4Press platform.
Data correspond to usage on the plateform after 2015. The current usage metrics is available 48-96 hours after online publication and is updated daily on week days.
Initial download of the metrics may take a while.