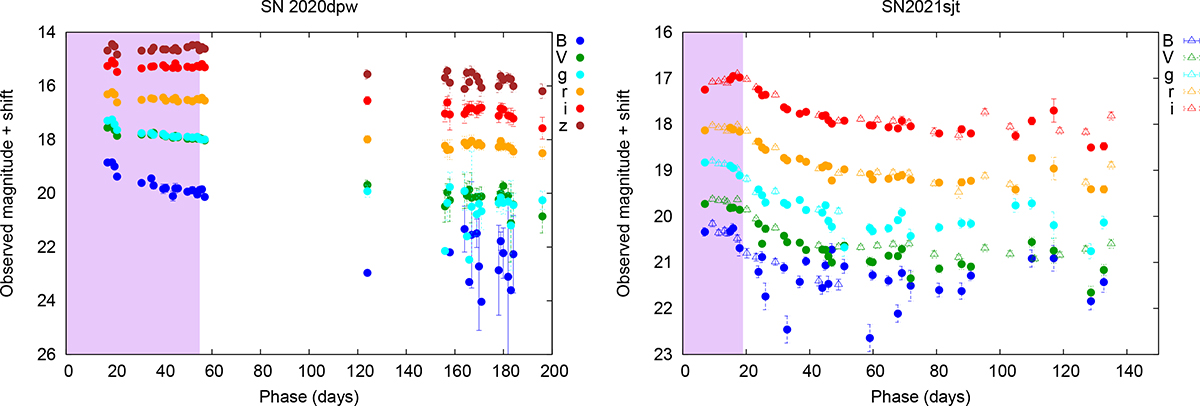
Fig. 2.
Download original image
Photometric data of SN 2020dpw (left) and SN 2021sjt (right) from different sources (see Section 2). The filled dots denote RC80 and BRC80 data, respectively, while the empty triangles are the LCO data. The purple-shaded regions in each panel refer to the time interval, where the expanding photosphere method was applied (see explanation in Sect. 4).
Current usage metrics show cumulative count of Article Views (full-text article views including HTML views, PDF and ePub downloads, according to the available data) and Abstracts Views on Vision4Press platform.
Data correspond to usage on the plateform after 2015. The current usage metrics is available 48-96 hours after online publication and is updated daily on week days.
Initial download of the metrics may take a while.