Fig. 7
Download original image
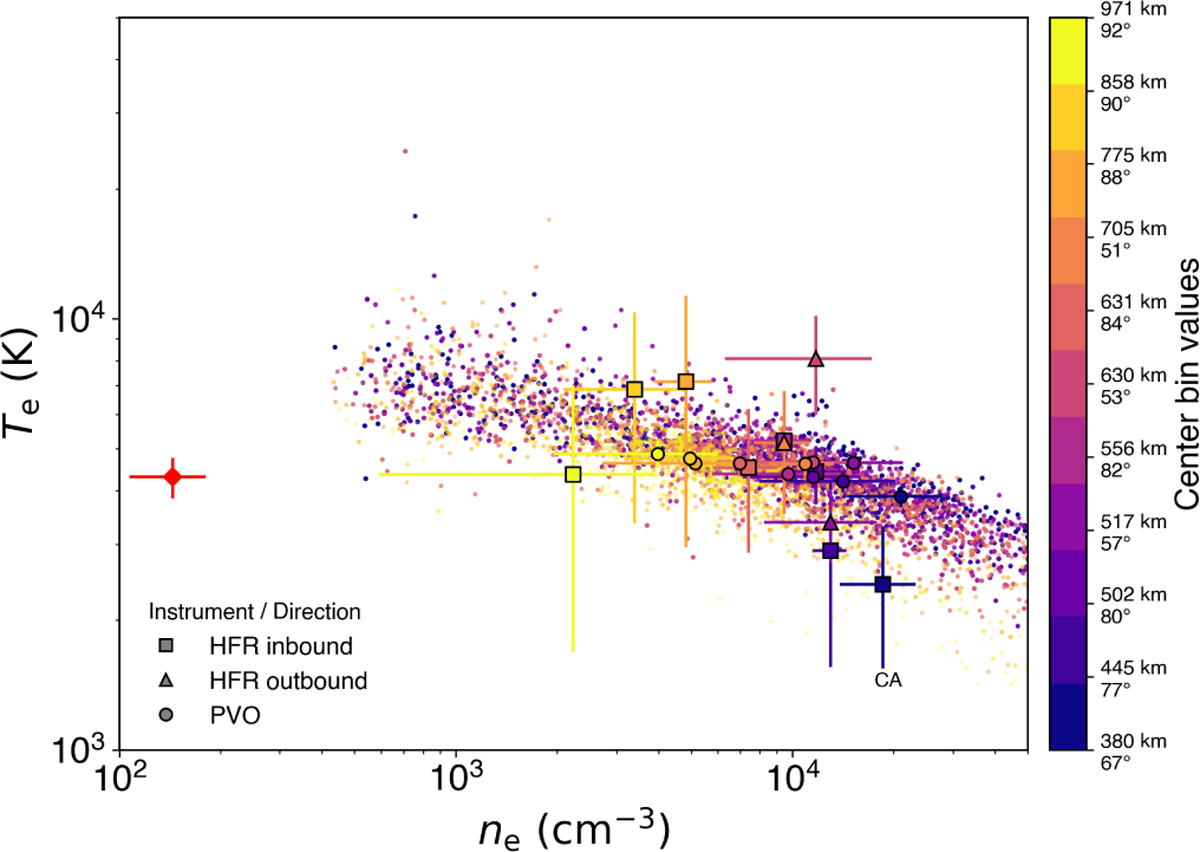
Electron density, ne, and temperature, Te, pairs as derived from RPW/HFR (squares: inbound; triangles: outbound) and measured by PVO/OETP (small dots) in 50 km × 1.5° altitude-SZA cells centered on each HFR measurement. Large dots correspond to the median values in each cell. The red diamond marks the PSP measurement (ne = 144 ± 37 cm−3, Te = 4294 ± 464 K, Tannous et al. 2024) during the VGA3 at about 830 km from Venus’ surface. The HFR measurement at CA is also indicated. The color scale denotes the bin centers. The error bars of the binned OETP measurements represent the total uncertainty, including both statistical and systematic contributions. The statistical contribution is given by the standard error of the sample mean while systematic uncertainties of 5% and 10% are assumed for temperature and density, respectively (Theis 1993).
Current usage metrics show cumulative count of Article Views (full-text article views including HTML views, PDF and ePub downloads, according to the available data) and Abstracts Views on Vision4Press platform.
Data correspond to usage on the plateform after 2015. The current usage metrics is available 48-96 hours after online publication and is updated daily on week days.
Initial download of the metrics may take a while.