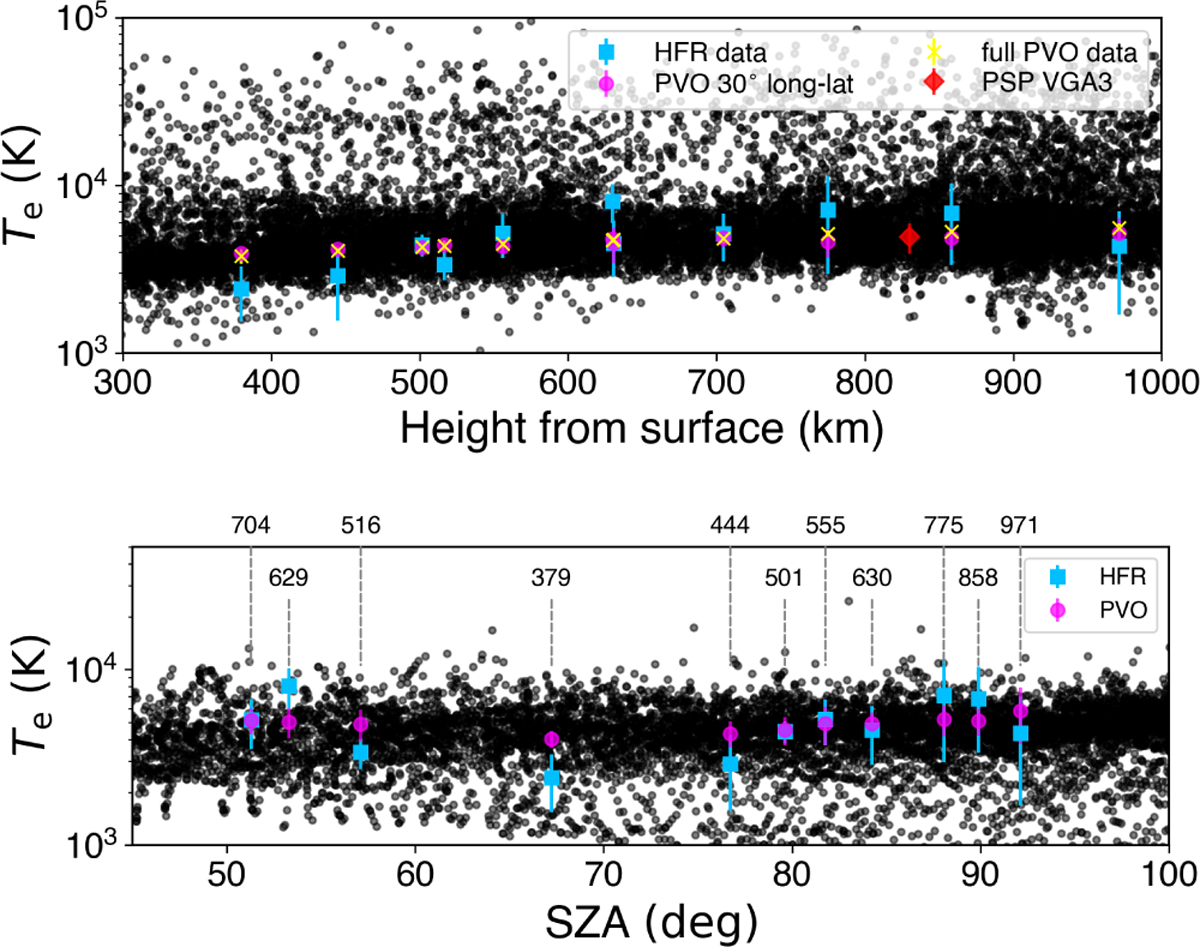
Fig. 6
Download original image
In-situ electron temperatures measured by PVO/OETP during January 1, 2025–January 1, 1983 and October 7, 1989–October 7, 1992 intervals (black dots). Electron temperatures derived from SO/RPW/HFR data (light-blue squares). Upper: colored symbols correspond to median PVO/OETP temperatures computed over 50 km altitude bins for the full dataset (yellow crosses) and within a 30° × 30° cell centered on the average SO latitude and longitude in the VSO frame (magenta dots). The red diamond marks the average temperature measured by PSP during VGA3 (Tannous et al. 2024). Lower: median PVO/OETP temperatures calculated over 50 km altitude bins and 1.5° SZA intervals (magenta dots). Numbers above the colored markers indicate the altitude at the center of each bin. The average electron temperature measured by PSP is outside the x-axis range of the current plot (SZA=136°) and is not shown. The error bars of the binned OETP measurements represent the total uncertainty, including both statistical and systematic contributions. The statistical contribution is given by the standard error of the sample mean (defined as the sample standard deviation, σ, divided by the square root of the sample size, N) while a 5% systematic uncertainty is assumed (Theis 1993).
Current usage metrics show cumulative count of Article Views (full-text article views including HTML views, PDF and ePub downloads, according to the available data) and Abstracts Views on Vision4Press platform.
Data correspond to usage on the plateform after 2015. The current usage metrics is available 48-96 hours after online publication and is updated daily on week days.
Initial download of the metrics may take a while.