Fig. A.1
Download original image
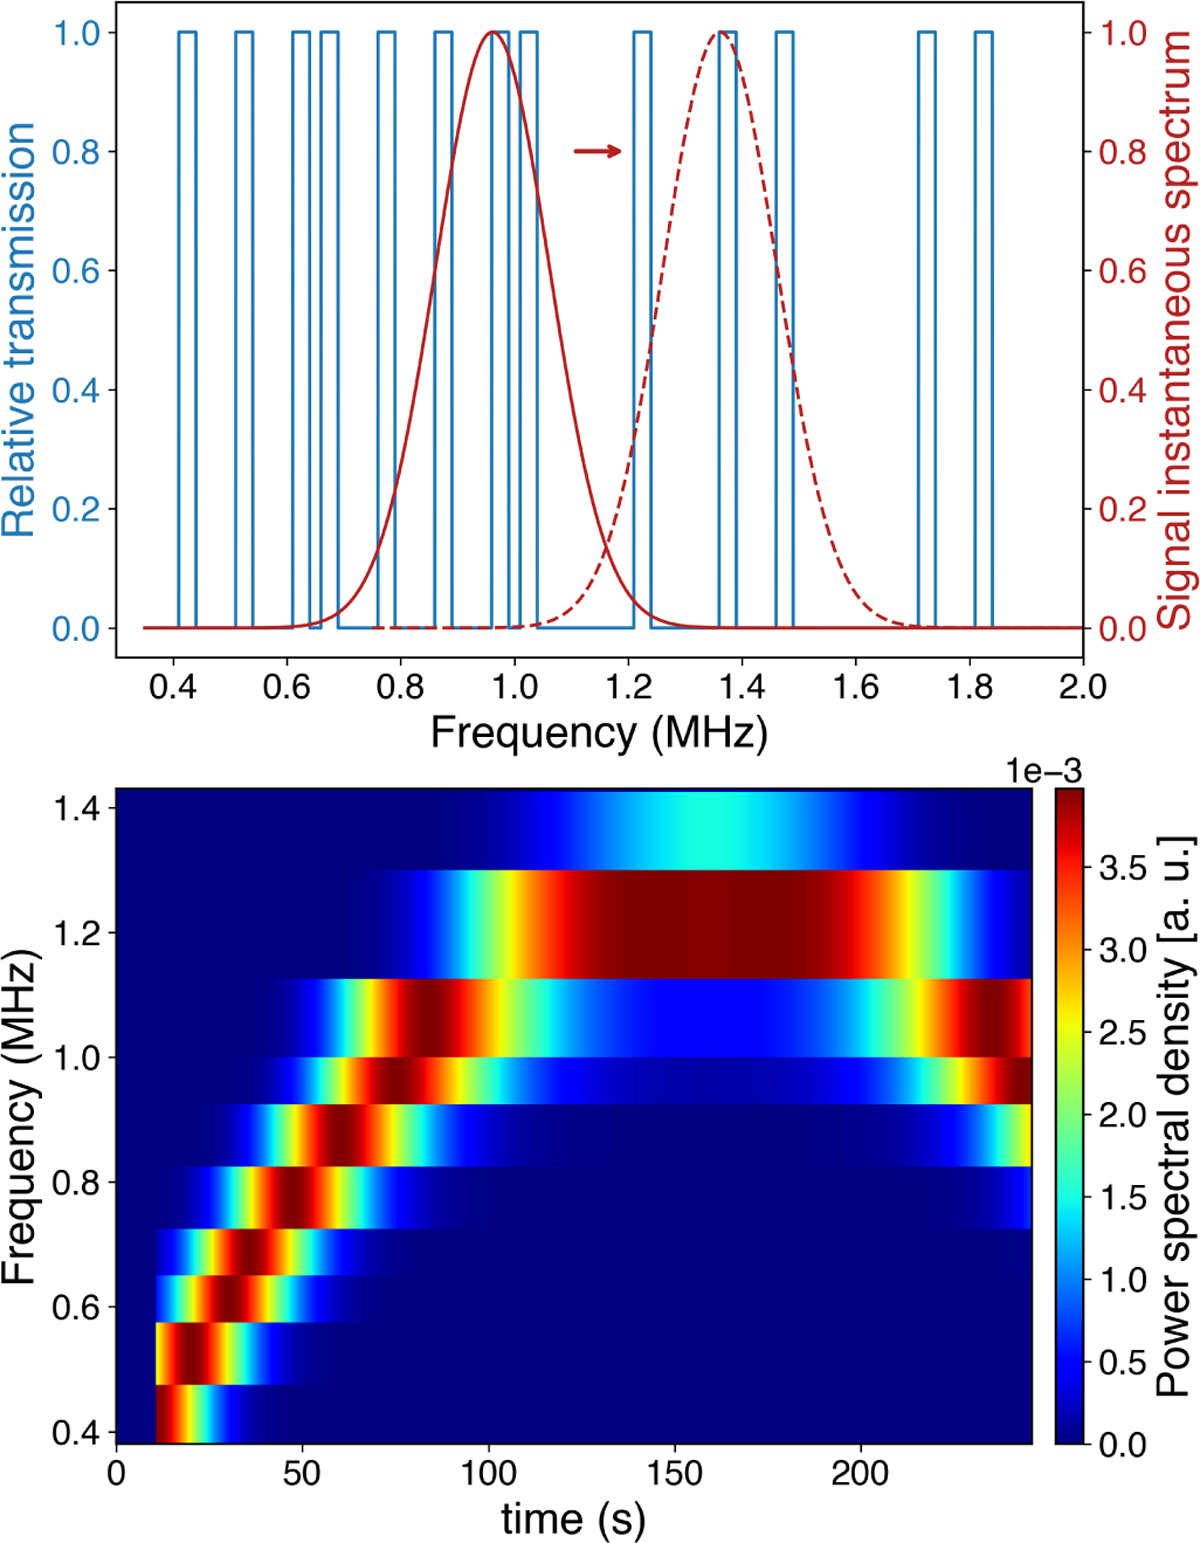
Upper: Relative transmission of the HFR filter resulting from the combination of the shape of the filter and the comb of chosen frequencies (blue lines). The Gaussian-shaped spectrum of the external signal is also shown (red lines). For sake of simplicity it peaks at 1. The solid and dotted lines refer to the spectrum of the external signal at two different time instants. The frequency drift of the spectrum over time is indicated by the arrow. Lower: synthetic HFR dynamic spectrum obtained by mimic the HFR response to an input frequency shifting Gaussian-shaped spectrum.
Current usage metrics show cumulative count of Article Views (full-text article views including HTML views, PDF and ePub downloads, according to the available data) and Abstracts Views on Vision4Press platform.
Data correspond to usage on the plateform after 2015. The current usage metrics is available 48-96 hours after online publication and is updated daily on week days.
Initial download of the metrics may take a while.