Fig. B.1
Download original image
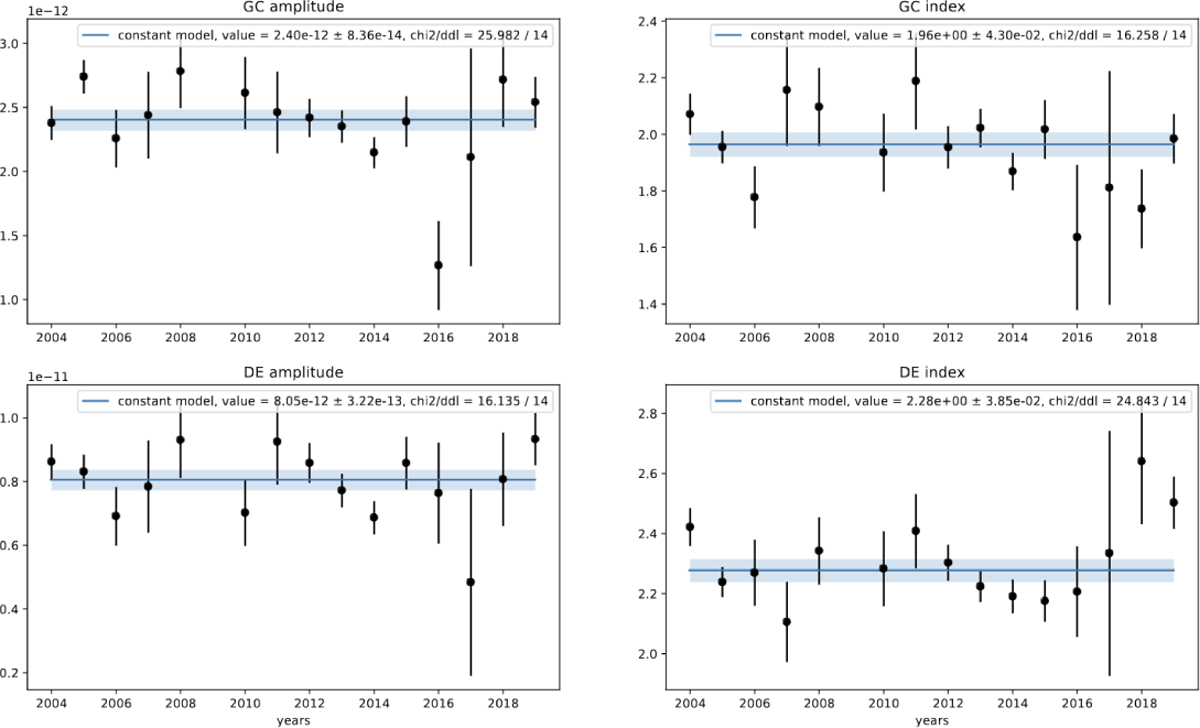
Evolution of the spectral index and normalization over time when left free to vary. Top: evolution of (left) the amplitude normalization and (right) spectral index of HESS J1745-290 with time. Bottom: evolution of (left) the amplitude normalization and (right) spectral index of the DE with time. In each panel, the blue line shows the best-fit constant value with its associated uncertainty. The corresponding χ2/d.o.f. values are indicated, showing that in all cases the parameters are compatible with being constant.
Current usage metrics show cumulative count of Article Views (full-text article views including HTML views, PDF and ePub downloads, according to the available data) and Abstracts Views on Vision4Press platform.
Data correspond to usage on the plateform after 2015. The current usage metrics is available 48-96 hours after online publication and is updated daily on week days.
Initial download of the metrics may take a while.