Fig. 3
Download original image
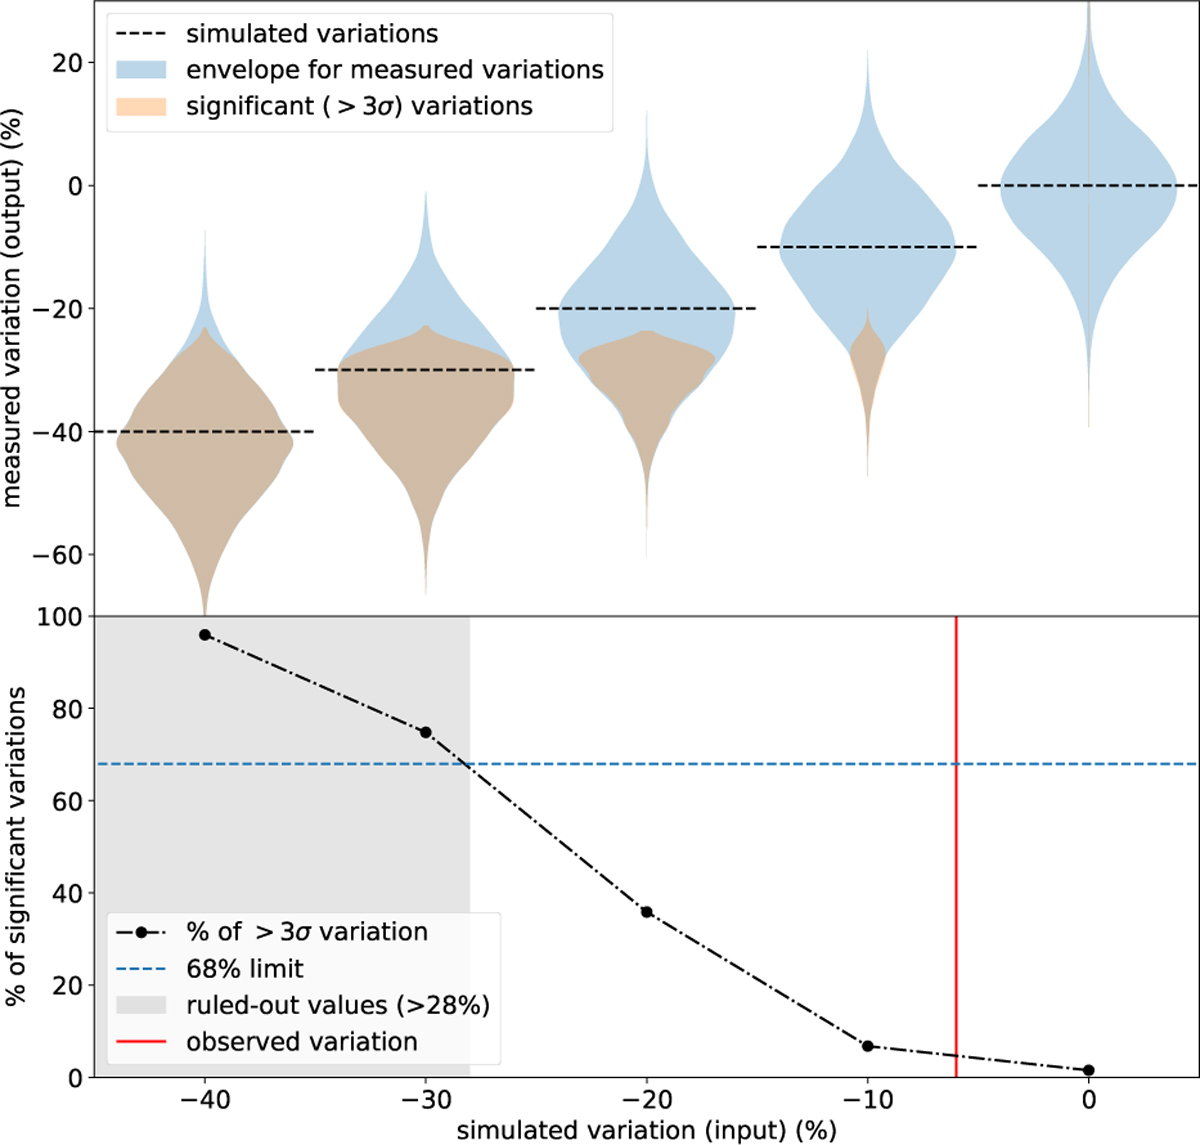
Top: results of the simulated linearly varying source. Each violin plot shows the distribution of detectable variations over 16 years for each simulated intrinsic variation (from 0 to –40%; a dashed black line indicates that the mean of this distribution equals the simulated value). The full distribution is shown in blue, and the distribution of detected variations that are significantly preferred to a constant solution is shown in orange. Bottom: percentage of simulated light curves exhibiting a significant linear variation over 16 years compared to a constant flux model, as a function of simulated source flux linear variation. This percentage increases with the amplitude of the variation, reaching 68% (dashed blue line) for a simulated linear variation of –28% (corresponding to a flux decrease of –1.75% per year over 16 years). The shaded region represents values of simulated linear variations that induce a detectable variation (at the 3σ confidence level) with a probability greater than 68%. The best-fit linear variation actually observed on the data (though not significantly) is shown by the red line.
Current usage metrics show cumulative count of Article Views (full-text article views including HTML views, PDF and ePub downloads, according to the available data) and Abstracts Views on Vision4Press platform.
Data correspond to usage on the plateform after 2015. The current usage metrics is available 48-96 hours after online publication and is updated daily on week days.
Initial download of the metrics may take a while.