Fig. 1
Download original image
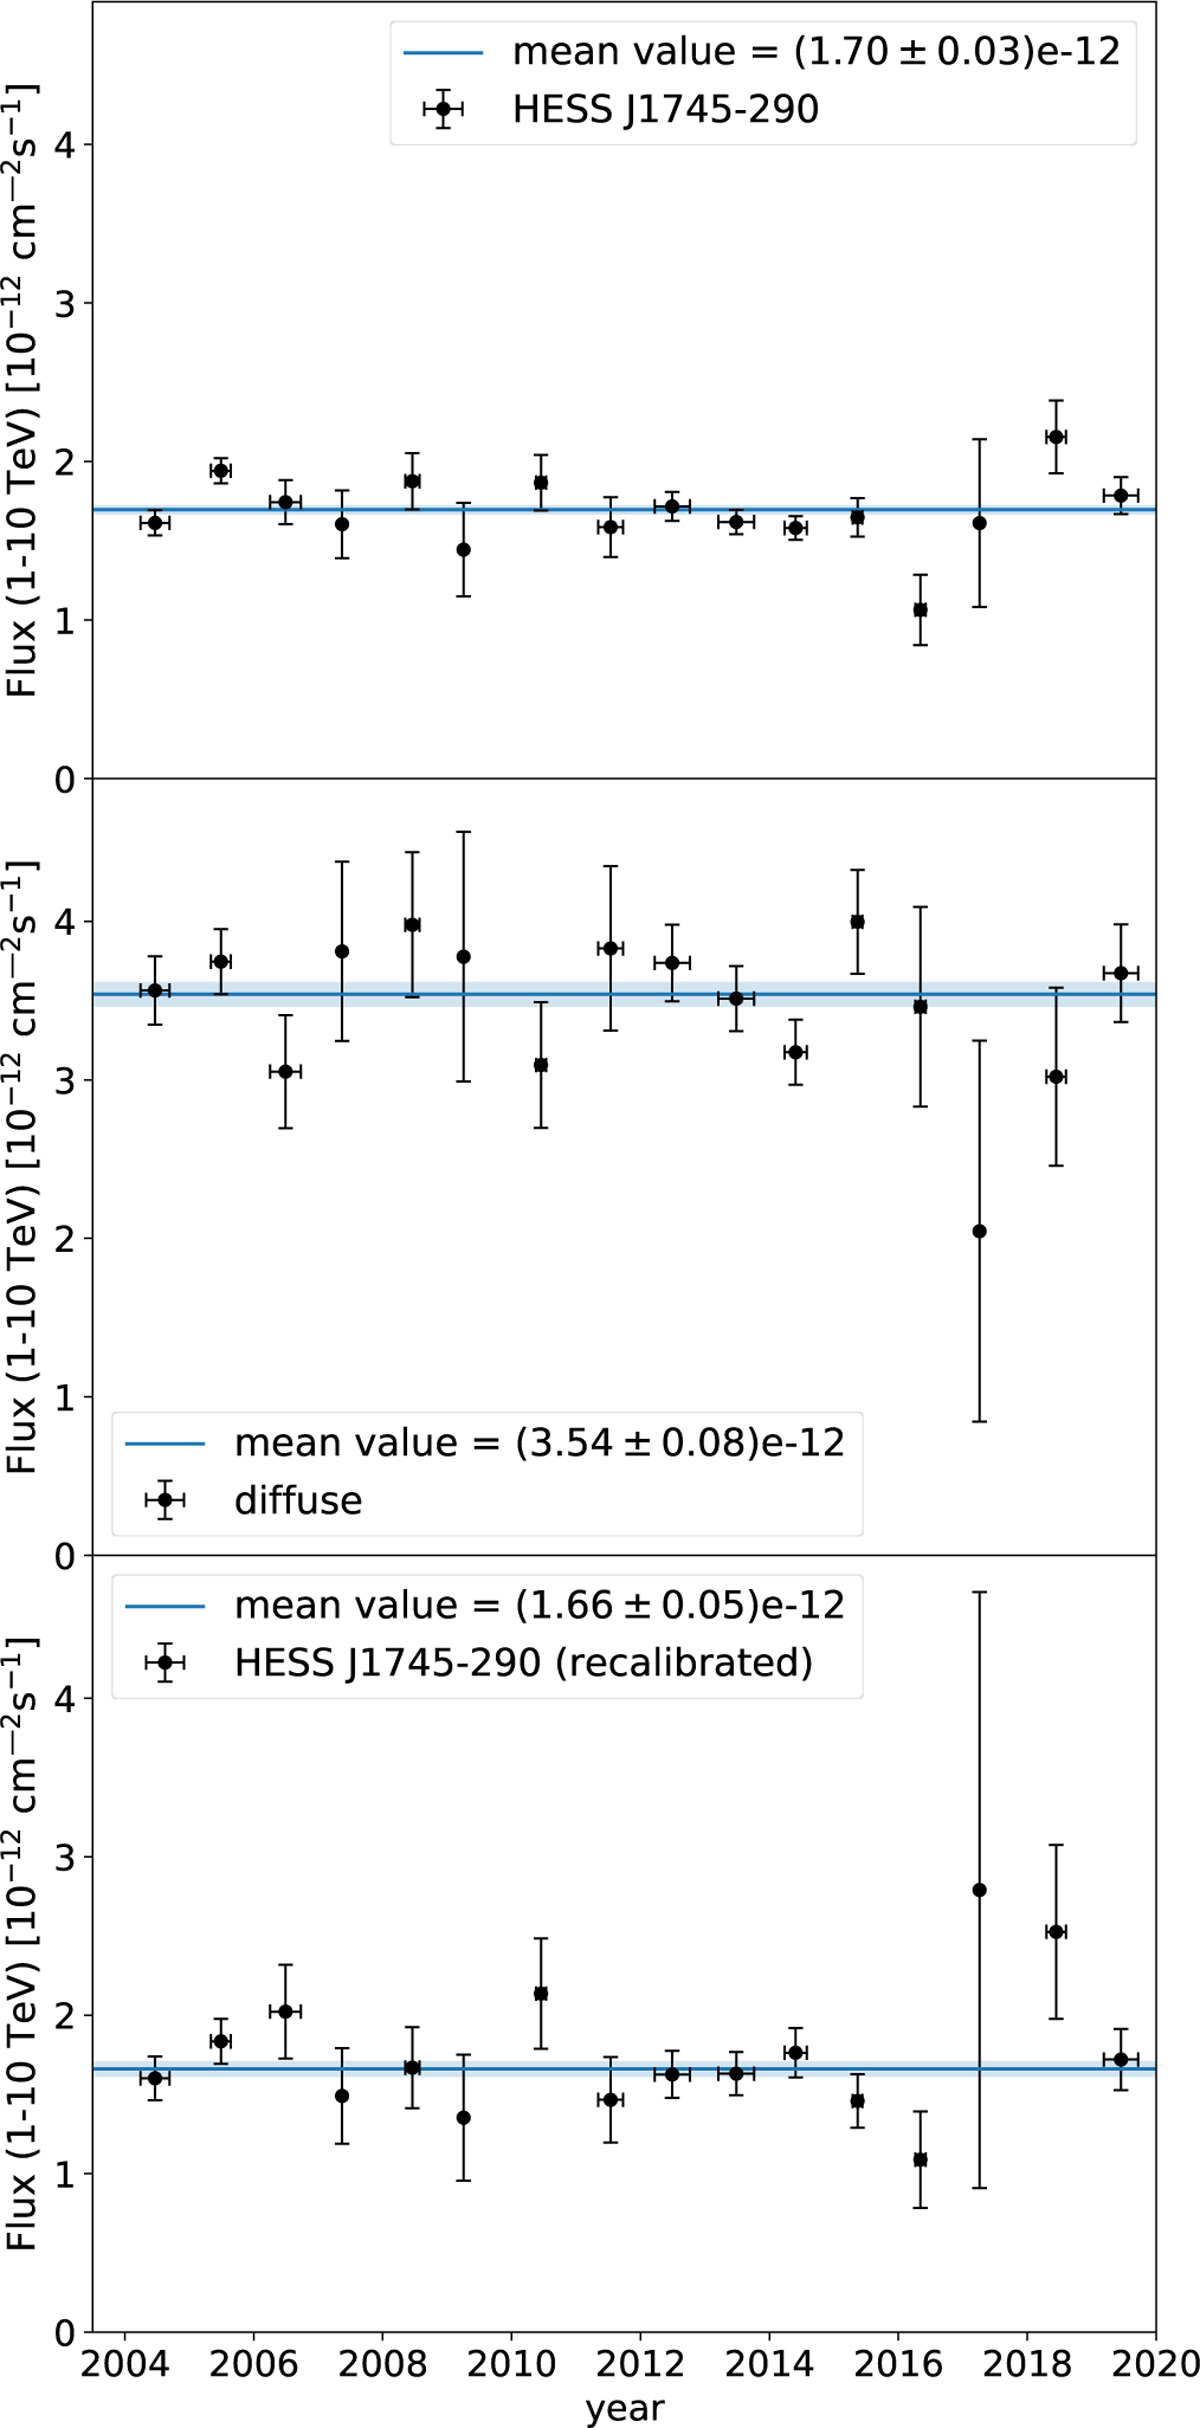
Light curves of HESS J1745-290 and DE. Black markers indicate fitted fluxes for each calendar year. Vertical error bars show the statistical error on the fitted flux for that year. Horizontal error bars indicate the span of the observations within each year. The blue line represents the statistical mean of the light curve, with flux uncertainties accounted for, and the band represents the uncertainty on this value. Top: Raw HESS J1745-290 light curve. Middle: DE light curve. Bottom: Recalibrated HESS J1745-290 light curve.
Current usage metrics show cumulative count of Article Views (full-text article views including HTML views, PDF and ePub downloads, according to the available data) and Abstracts Views on Vision4Press platform.
Data correspond to usage on the plateform after 2015. The current usage metrics is available 48-96 hours after online publication and is updated daily on week days.
Initial download of the metrics may take a while.