Fig. 7
Download original image
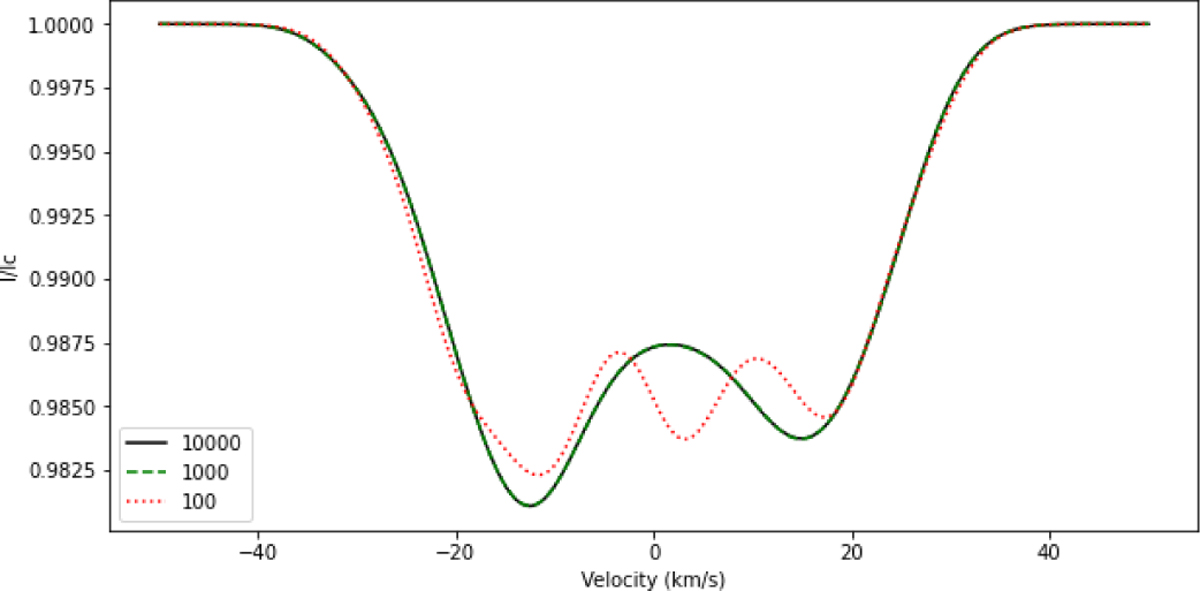
Comparison between the line profiles of a ℓ = 5, m = −5 mode generated for three different resolutions. The solid black line is the higher resolution model using 10 000 equally sized cells on the stellar surface, while the green dashed line is the 1000 cell moderate resolution model, and the red dotted line is the lower resolution model using only 100. The agreement between the 10 000 and 1000 cell models show that the shape of the 100 cell model is incorrect due to an insuffucient resolution.
Current usage metrics show cumulative count of Article Views (full-text article views including HTML views, PDF and ePub downloads, according to the available data) and Abstracts Views on Vision4Press platform.
Data correspond to usage on the plateform after 2015. The current usage metrics is available 48-96 hours after online publication and is updated daily on week days.
Initial download of the metrics may take a while.