Open Access
Fig. 3
Download original image
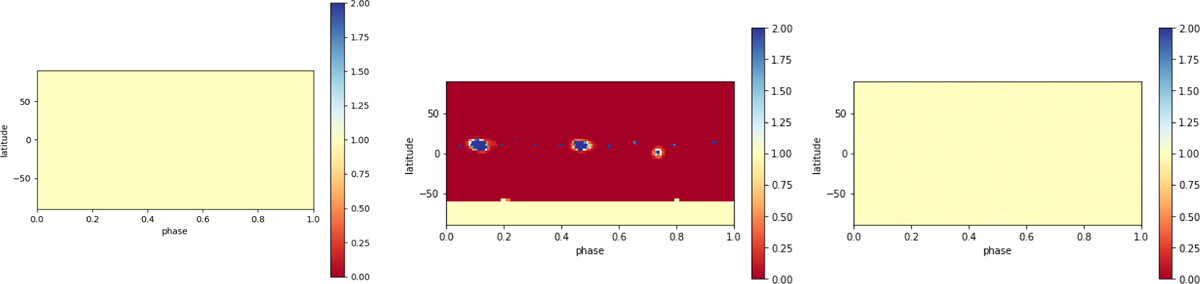
Results of a test for a dipolar star with uniform brightness. The left-hand plot is the brightness map used to generate the model line profiles we test the codes on, the middle is the best-fit brightness map produced by ZDIPY, and the final plot is the best-fit brightness map produced by PIMMS.
Current usage metrics show cumulative count of Article Views (full-text article views including HTML views, PDF and ePub downloads, according to the available data) and Abstracts Views on Vision4Press platform.
Data correspond to usage on the plateform after 2015. The current usage metrics is available 48-96 hours after online publication and is updated daily on week days.
Initial download of the metrics may take a while.