| Issue |
A&A
Volume 709, May 2026
|
|
|---|---|---|
| Article Number | A12 | |
| Number of page(s) | 11 | |
| Section | Catalogs and data | |
| DOI | https://doi.org/10.1051/0004-6361/202555784 | |
| Published online | 28 April 2026 | |
Source identification for the Swift-BAT 150-month hard X-ray catalog using soft X-ray observations
1
Department of Physics and Astronomy, Clemson University,
Kinard Lab of Physics,
Clemson,
SC
29634-0978,
USA
2
Department of Astronomy, University of Virginia,
PO Box 400325,
Charlottesville,
VA
22904,
USA
3
Dipartimento di Fisica e Astronomia (DIFA), Università di Bologna,
via Gobetti 93/2,
40129
Bologna,
Italy
4
INAF – Osservatorio di Astrofisica e Scienza dello Spazio di Bologna,
Via Piero Gobetti 93/3,
40129
Bologna,
Italy
5
European Southern Observatory,
Alonso de Córdova 3107, Casilla 19,
Santiago
19001,
Chile
6
Department of Astronomy, University of Illinois at Urbana-Champaign,
Urbana,
IL
61801,
USA
7
Cahill Center for Astrophysics, California Institute of Technology,
1216 East California Boulevard,
Pasadena,
CA
91125,
USA
8
INFN, Sezione di Catania,
Catania,
Italy
9
Istituto di Astrofisica Spaziale e Fisica Cosmica di Palermo (INAF),
Palermo,
Italy
10
Jet Propulsion Laboratory, California Institute of Technology,
Pasadena,
CA
91109,
USA
★ Corresponding author: This email address is being protected from spambots. You need JavaScript enabled to view it.
Received:
2
June
2025
Accepted:
22
January
2026
Abstract
We present a comprehensive catalog of 251 potential counterparts for 250 unassociated hard X-ray sources detected in the Swift -Burst Alert Telescope (BAT) 150-month hard X-ray survey. During 150 months of observation, BAT detected 2339 sources in the 15-150 keV range. Among these, 344 do not have a low-energy counterpart. Our study focuses on the analysis of soft X-ray observations (i.e., at energies <10 keV) spatially overlapping with these Swift-BAT new hard X-ray sources. These observations were taken with Chandra, Swift-XRT, eROSITA, and XMM-Newton. Within the sample of 251 potential counterparts, 94 (37%) are identified as active galactic nuclei (AGN) and 58 (23%) as galaxies. The rest of the 99 sources (40%) include pulsars, cataclysmic variables, and unclassified soft X-ray (0.5-10 keV) counterparts. Redshift data is available for 139 out of the 251 sources, and its distribution are in close agreement with the redshift distribution of previous BAT catalogs. We also present the results of a small optical spectroscopy campaign of 9 of the 58 galaxies. The majority of these turned out to be Seyfert 2 galaxies at a redshift slightly higher than the median of the BAT AGN sample.
Key words: astronomical databases: miscellaneous / catalogs / galaxies: active / quasars: supermassive black holes
ESO Fellow.
© The Authors 2026
 Open Access article, published by EDP Sciences, under the terms of the Creative Commons Attribution License (https://creativecommons.org/licenses/by/4.0), which permits unrestricted use, distribution, and reproduction in any medium, provided the original work is properly cited.
This article is published in open access under the Subscribe to Open model. This email address is being protected from spambots. You need JavaScript enabled to view it. to support open access publication.
1 Introduction
The exploration of the cosmos across various electromagnetic wavelengths has been instrumental in unraveling the mysteries of the Universe, from the dynamics of star formation to the behavior of supermassive black holes (SMBHs) at the centers of galaxies. Among these wavelengths, hard X-rays (15-150 keV) provide a unique window into some of the most extreme and energetic phenomena of the Universe, for example the accretion of matter onto supermassive black holes and jet emission from blazars (e.g., Liang 1979; Ubertini et al. 1984; Marcotulli et al. 2022). Hard X-rays can penetrate dense environments, such as the cores of galaxies, where supermassive black holes reside, or regions where stars are forming. By surveying the sky in hard X-rays, we can peer through obscuring material, such as dust and gas.
The Burst Alert Telescope (BAT; Barthelmy et al. 2005) on board the Neil Gehrels Swift Observatory is primarily designed to detect gamma-ray bursts in the 15-150 keV energy range. While waiting for gamma-ray bursts, it continuously scans the sky and collects data from hard X-ray sources, thus allowing us to study hard X-ray sources (e.g., Ajello et al. 2008b; Baumgartner et al. 2013; Oh et al. 2018). As an example, the Swift-BAT 70-month catalog has been used to study the correlations between X-ray continuum emission and optical narrow emission lines (Berney et al. 2015) and the link between active galactic nucleus (AGN) Eddington ratios and narrow emission line ratios (Oh et al. 2017), among others.
The 105-month BAT catalog (Oh et al. 2018) has been used to measure the high-energy cutoff for local AGN (Ricci et al. 2017), thus putting constraints on the physical properties of the hot corona responsible for the X-ray emission (Marinucci et al. 2018). Several other studies (e.g., Wang et al. 2019; Hinkle & Mushotzky 2021) have been conducted on the properties of the X-ray corona by selecting sources from the 105-month Swift-BAT catalog, although a full understanding of the mechanisms behind the coronal emission is still to be achieved. The Swift-BAT catalog has also been useful in studying what are called changing look AGN (e.g., Temple et al. 2023; Ricci & Trakhtenbrot 2023), a class of AGN that exhibits dramatic, relatively rapid changes in their observed properties, particularly in their optical or X-ray emission. These changes include transitions between different optical spectral classifications (e.g., from a Type 1 to a Type 2 AGN or vice versa) and significant variations in luminosity.
In the hard X-ray regime (E > 10 keV), the Cosmic X-ray Background (CXB; Giacconi et al. 1962; Gilli et al. 2007; Ajello et al. 2008a) is primarily dominated by SMBHs accreting gas at the centers of galaxies. A subset (∼10%) of these AGN launches relativistic jets, and when these jets align closely with our line of sight, they are identified as blazars. Blazars are divided into two main subclasses, flat-spectrum radio quasars (FSRQs) and BL Lacertae objects (BL Lacs), distinguished by the strength of their optical emission lines; FSRQs display lines stronger than 5Å in equivalent width, while BL Lacs exhibit weak or absent lines (e.g., Schmitt 1968; Stein et al. 1976).
Previous studies (e.g., Ajello et al. 2009; Toda et al. 2020) have shown that blazars, especially the FSRQ subclass, increase in number with redshift in this energy range, indicating that they were more numerous and/or luminous at earlier cosmic times. A study by Marcotulli et al. (2022) analyzed Swift-BAT blazars and their jets across cosmic time, and found that FSRQ-dominated blazars evolve positively up to z ∼ 4.3, but are less abundant at high redshifts than previously estimated. Blazars contribute 5%-18% to the cosmic X-ray background (in the 14-195 keV energy range) and could account for nearly 100% of the MeV background (Ajello et al. 2009; Marcotulli et al. 2022), making them key contributors to the unresolved MeV gamma-ray population. These findings refined our understanding of blazar evolution, jet physics, and their contribution to cosmic backgrounds.
The Swift-BAT 100-month catalog (Segreto et al. 2015) contains 1710 hard X-ray sources and has been used extensively for extended campaigns of follow-up observations with X-ray facilities aimed at obtaining a complete characterization of the obscuring medium surrounding accreting SMBHs at z < 0.05 (e.g., Marchesi et al. 2019; Zhao et al. 2019a,b; Torres-Albà et al. 2021; Zhao et al. 2021; Silver et al. 2022; Sengupta et al. 2023). Many studies at different wavelengths (e.g., Antonucci & Miller 1985; Combes et al. 2019; Hönig 2019) across the years have allowed us to build a scenario where most of this obscuration is due to a distribution of material located in close proximity (1-10 pc) of the accreting supermassive black hole, historically called the torus. The atomic and molecular gas density in the torus is typically parameterized in X-rays as the line-of-sight neutral hydrogen column density NH,los. When the obscuring matter has a column density equal to or greater than the inverse of the Thomson cross section σT, NH,los ≥ σT ≃ 1.5 × 10⁻²⁴ cm−2, the source is defined as a Compton-thick (CT) AGN. The presence of CT AGN can explain the excess of emission around the Compton hump (∼30 keV) in the CXB. Models of AGN population indicate that the Compton-thick fraction in the local universe could be up to 30-50% (e.g., Gilli et al. 2007; Ananna et al. 2019). However, X-ray surveys have shown that this fraction is only < 10% (Ricci et al. 2015; Torres-Albà et al. 2021), indicating a population of CT AGN that is still undetected. A hard X-ray survey is thus essential in order to find CT AGN candidates in this scenario, considering that the highly energetic hard X-ray photons can pass through large column densities of dust and gas, revealing CT AGN (e.g., Burlon et al. 2008; Ricci et al. 2015; Koss et al. 2016).
The Swift-BAT 150-month catalog (Segreto et al. in prep., available online at Swift-BAT 150-month catalog) comprises 2339 sources, of which 344 lack a low-energy counterpart. Among these 344 sources, 250 have available soft X-ray data (i.e., at energies below 10 keV). For these 250 sources, there are 251 possible counterparts, among which 179 counterparts above the galactic plane (|b| > 10°) and 72 counterparts within the galactic plane (|b| < 10°). For this work, we used these data to determine the counterparts and we present detailed source classifications for 250 sources.
Our work is organized as follows. Section 2 discusses the data analysis of soft X-ray observations. Section 3 is devoted to the procedure of counterpart association for BAT sources. Section 4 presents the properties of the 250 BAT sources. Finally, Section 5 is dedicated to the results of our work and further discussion.
We use Anders & Grevesse (1989) cosmic abundances, fixed to the solar value, and the Verner et al. (1996) photoelectric absorption cross section. The luminosity distances in this work are computed assuming a cosmology with H0 = 70 km s−1 Mpc−1, ΩM = 0.3, and ΩΛ = 0.7.
2 Data analysis of soft X-ray observations
We submitted1 (and were granted) a Swift proposal to observe for 2ks, with Swift -XRT, 111 (out of 344) 150-month Swift -BAT sources lacking soft X-ray coverage. For the remaining 233 unassociated BAT sources, we searched for soft counterparts by employing data from the X-ray Multi-Mirror Mission (XMM-Newton Jansen et al. 2001), Chandra X-ray telescope (Weisskopf et al. 2002), Swift-XRT (Burrows et al. 2005), and extended ROentgen Survey with an Imaging Telescope Array (eROSITA Predehl et al. 2007, 2021) archives, and found observations for 139 out of 233 sources. For the remaining 94 sources, either there is no observation available, or there is some X-ray observation covering the BAT position (by Swift-XRT), but no sources detected over the background.
For each source, we downloaded the XMM-Newton/ Chandra / Swift-XRT data from the NASA High Energy Astrophysics Science Archive Research Center2 (HEASARC) querying around the BAT source coordinates with the maximum allowed separation radius of 6′ between the BAT coordinates and the center of the X-ray observation. We found XMM-Newton observations for ten sources. We reduced the XMM-Newton data using the SAS v18.0.0 (Gabriel 2017) after cleaning for flaring periods, adopting standard procedures. We found Chandra data for 13 sources. We reduced the Chandra data using CIAO v4.12 (Fruscione et al. 2006). We then found 201 sources that were observed with Swift-XRT. We reduced the Swift-XRT data using HEASoft version 6.31 (Nasa High Energy Astrophysics Science Archive Research Center 2014). In the cases where multiple XRT observations are available, we stacked the event files into one summed event file following the XSELECT user guide. Similarly, we stacked images using the XIMAGE instruction manual for Swift-XRT. We used the XRT instrument software version 3.7.0 for analysis with the most recent CALDB version at the time of analysis (1.0.2). Finally, we searched for counterparts in the eROSITA (Merloni et al. 2024) catalog, and found a counterpart for 27 BAT sources lacking a soft X-ray counterpart from any of the other instruments mentioned above. These sources are within the region of the western Galactic hemisphere, covered by the public eROSITA data release. For each source, we used the eROSITA sky view tool3 (Tubín-Arenas et al. 2024) to identify counterparts within the BAT R95 region.
There are 30 cases in Chandra and Swift-XRT observations where multiple soft X-ray sources (0.3-10 keV) exist within the BAT 95% confidence positional uncertainty region (BAT R95). In such cases, a spectrum was extracted to compare the two possible counterparts. For Chandra, we extracted the source spectra from a 5" circular region centered around the source, and the background spectra were obtained using an annulus (inner radius 6″, outer radius 15″) surrounding the source, excluding any resolved sources. For Swift-XRT observations, the source spectra were extracted from a 20″ circular region, while the background spectra were obtained using an annulus (inner radius 30″, outer radius 60″) surrounding the source, excluding any resolved sources. We then fitted the data using XSPEC (Arnaud 1996) version 12.13.0 with a power-law model and employing c-statistics (Cash 1979). We further used a power-law model to extrapolate the observation data to the 15-150 keV range to estimate the flux for all sources within the R95. We considered only the brightest source (i.e., the source with the highest 15-150 keV flux) as the possible counterpart if the difference between extrapolated fluxes is larger by a factor of 10. We further discuss the counterpart identification process for these BAT sources in Section 3.1.1.
3 Procedure for source association
We use soft X-ray observations to identify counterparts for BAT-detected sources because telescopes covering the 0.5-10 keV energy range typically offer much better positional accuracy than hard X-ray missions. The on-axis point spread function (PSF) is usually described by the half energy width (HEW), defined as the diameter containing 50% of the flux. For XMM-Newton, at 1.5 keV, the HEW values are 16.6″ for pn, 16.8″ for MOS1, and 17.0″ for MOS24. For Chandra, the on-axis HEW is less than 0.5″ (Chandra Proposal Guide v.155). For Swift-XRT, the HEW values measured on-axis range from 16″ (at 0.28 keV) to 22″ (at 8.05 keV) (Moretti et al. 2004). The on-axis HEW for eROSITA is 15″ (Predehl et al. 2010). On the other hand, the median BAT 95% confidence positional uncertainty region (R95) is 4.3′ (see Section 5).
In most soft X-ray observations, the field of view (FoV) typically includes a single soft X-ray source within the BAT R95 region, which we identify as the likely counterpart. Previous instances of the 54-month Palermo BAT catalog (Cusumano et al. 2010) use a 6′ radius6 (99.7% confidence level for a source detection at 4.8σ Segreto et al. 2010). Therefore, we consider (as the counterpart of the BAT source) those soft X-ray sources located at a distance between R95 and 6′, if no soft X-ray source is found within R95.
Using the coordinates of the soft X-ray counterpart, we attempt to associate the source with a lower frequency counterpart whenever possible, thus providing the object type and redshift. Whenever feasible, we report the source based on its type (e.g., galaxy, AGN, and blazar) from the SIMBAD7 and NED8 databases. If the source type classification is not available on the SIMBAD/NED databases, we report the source as infrared (IrS), radio (RadioS), or soft X-ray (X, energy band 0.3-10 keV).
In the following subsections, we present a set of flags to clarify how the counterpart is chosen. The different flags are summarized in Table 1.
Summary of symbols used to flag different source associations.
3.1 Flag 1 and Flag 2
Flag 1 indicates cases where the candidate counterparts (single or multiple sources) are within the respective R95 . Out of 251 associated BAT sources, we have 197 (78%) sources with Flag 1.
Flag 2 identifies sources that do not have a counterpart within the R95 circle, but have one within a 6′ radius. There are 48 sources located in the region between the R95 and a 6′ radius. Additionally, six sources are detected with their emission centroid outside the 6′ circle, but their localization uncertainty region overlaps the 6′ circle. These sources are also classified under Flag 2. In total, out of 251 associated BAT sources, we have 54 (22%) sources categorized under Flag 2.
3.1.1 Flag s and Flag m
Flag s identifies sources with a single soft X-ray counterpart candidate. When only one soft X-ray source is present within the BAT R95, we assume that source to be the counterpart to the BAT detection. Figure 1 illustrates such a case, where only one soft X-ray source is clearly found within the BAT R95.
Flag m identifies sources with multiple soft X-ray counterpart candidates. In this scenario, multiple sources are present within the BAT R95 . We extract a spectrum for each source individually and then analyze it using XSPEC, as detailed in Section 2, and further extrapolate the data using a power-law model to predict flux in the 15-150 keV band. We assume the source with higher flux to be the BAT counterpart.
In the case of Flag m, we mostly fitted unobscured power laws, but we encountered sources for which we had to fit an obscured power law. We did so when an unobscured power law resulted in a poor fit (i.e., cstat/d.o.f. > 1.5) or the photon index of a simple power law was <1.4. Depending on data quality, we fitted both the photon index and the absorbing column density; for those sources without enough counts (<55 counts) in the 0.3-10 keV band, we instead chose to fix the photon index to the typical value, for Seyfert galaxies, of Γ=1.8 (e.g., Dadina 2008; Ricci et al. 2011), and measured the line-of-sight column density by leaving it as a free parameter.
Figure 2 illustrates a case where two sources are present in the BAT R95 in the 0.3-10 keV band, WISEA J193714.86-401014.4 and LEDA 588288. The spectral fitting and power-law extrapolation predict a flux in the range 7.3×10⁻¹³ erg s−1 cm−2 to 1.8×10⁻¹² erg s−1 cm−2 and 3.8×10⁻¹⁰ erg s−1 cm−2 to 8.5×10⁻¹⁰ erg s−1 cm−2 for WISEA J193714.86-401014.4 and LEDA 588288 respectively in the energy band 15-150 keV, we thus assumed LEDA 588288 to be the BAT counterpart.
For just one source in our sample, J1159.5+2913, we ended up with a double association. Two soft X-ray sources are present in the R95; Ton 599 (Seyfert 1; Sy1 hereafter) at redshift 0.72 with flux 2.4 × 10⁻¹² erg s−1 cm−2 in the 0.3-10 keV band and projected flux of 5.1 × 10⁻¹² erg s−1 cm−2 in 15-150 keV band) and LEDA 1857480 (Sy1 at redshift 0.083 with flux 1.1 × 10⁻¹² erg s−1 cm−2 in the 0.3-10 keV band and projected flux of 8.0 × 10⁻¹² erg s−1 cm−2 in 15-150 keV band). As they have a similar extrapolated flux in the 15-150 keV band, we did not pick one over the other as the most likely counterpart, and in fact we suspect they both are likely contributing to the BAT source.
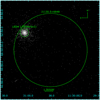 |
Fig. 1 Swift-XRT observation of a single source (smaller circle) in the BAT R95 (bigger circle) for the BAT source J1130.5+6848 in the energy band 0.3-10 keV. Only one bright soft X-ray source (whose optical counterpart is the galaxy LEDA 139586) is present within the BAT R95, which we identify as the BAT counterpart. |
3.1.2 Flag eR
Flag eR indicates an eROSITA source. These sources are detected using eROSITA Data Release 1 (Merloni et al. 2024; Tubín-Arenas et al. 2024). We employ the eROSITA Sky View Tool to identify soft X-ray sources within the BAT R95. If a single source is found within the R95, we classify it as the potential counterpart. In cases where multiple eROSITA sources are detected, we designate the source with higher flux in the 0.2-2.3 keV energy range as the primary counterpart. If multiple sources exhibit similar fluxes (flux on the order of 10−13 erg s−1 cm−2 in the energy band 0.2-2.3 keV), we refrain from designating any of them as a possible counterpart in this catalog, due to the lack of an effective criterion for selection. We assign a separate flag to eROSITA sources as further scrutiny is needed to confirm them due to the soft nature of the eROSITA catalog. We recommend exercising caution when taking any of these sources as the true BAT counterpart, particularly in cases where multiple candidates are present.
3.2 Unassociated and unobserved
Unassociated sources (ua) are those for which soft X-ray observation data are available, but no soft X-ray source is found within the BAT R95 or 6′ in the 0.3-10 keV band. There are 57 such sources; for each, we provide the BAT-detected coordinates in Table 2.
Unobserved sources (uo) are the sources for which either no soft X-ray observation is available or the BAT-detected region has been only partially observed. Therefore, we report these 37 sources as unobserved and provide their BAT-detected coordinates in Table 2.
4 Description of the newly associated BAT sources
We present a catalog of 250 originally unassociated sources from the Swift-BAT 150-month catalog (Segreto et al., in prep.). We list the first few sources from the catalog in Table 2 (the full catalog is attached as a machine readable file), which includes the following information:
Col. 1 reports the BAT catalog name of the source.
Col. 2 and Col. 3 give the right ascension (RA BAT) and declination (Dec BAT) of the BAT source in the FK5 coordinate system.
Col. 4 reports the BAT 95% confidence positional uncertainty region (R95) in arcmin.
Col. 5 reports the flags, as presented in Section 3.
Col. 6 and Col. 7 report the RA and Dec of the counterparts, determined from the SIMBAD/NED databases.
Col. 8 and Col. 9 report the galactic latitude (l) and galactic longitude (b) of the counterparts.
Col. 10 reports the name of the counterpart, as taken from the SIMBAD/NED databases.
Col. 11 reports the source type of the counterpart, as reported in the SIMBAD/NED databases. This includes galaxies with reported AGN activity: Seyfert galaxies of unknown types (SyG), Seyfert 1 galaxies (Sy1), Seyfert 2 galaxies (Sy2), quasars (QSO), blazars (Bz), and galaxies without any reported AGN activity (G). This also includes sources not firmly associated with an object type, and instead classified as infrared (IrS), radio (RadioS), and soft X-ray (X) sources.
Col. 12 reports the redshift taken from the SIMBAD/NED databases. We report sources with no available redshift as N/A.
5 Results and discussion
As discussed in the previous sections, for the complete sample of 344 initially unassociated sources, soft X-ray observations are available for 250 sources. Using the association methods described in Section 3, we identified possible counterparts for those sources (see Table 2). For the remaining sources, the data are either absent or insufficient, which means the BAT R95 is covered partially, or the exposure time is too short (typically <0.7 ks) to confirm the counterpart. We note that among the 251 identified sources, 179 sources lie outside the Galactic plane (|b| > 10°) and 72 sources lie within it (|b| < 10°), as shown in Table 3.
Of the 251 sources, redshift information is available for 139 sources on the SIMBAD/NED databases or the Milliquas catalog (Flesch 2023). Among these 139 sources, 98 are located at z < 0.1, and 37 additional sources9 are in the range 0.1 < z < 1.9.
Of the 135 sources that are not blazars, 89 are known AGN (including Seyferts, AGN, and QSOs), and 46 are classified as galaxies (galaxies with no prior knowledge of the presence of an AGN). Figure 3 shows the redshift distribution of these 89 AGN and 46 galaxies.
Figure 4 presents the distribution of sources in Galactic coordinates using a Hammer-Aitoff projection. It is observed that many sources categorized as X-ray sources (X), infrared sources (IrS), or those that remain unassociated and/or unobserved and that lack definitive identification are located above the Galactic plane. This suggests that a non-negligible fraction of the unassociated sources are in fact AGN. Further investigation of these sources may confirm or rule out this hypothesis.
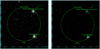 |
Fig. 2 Swift-XRT observation for the BAT source J1937.4-4013 in the energy band 0.3-5 keV (left panel) and 5.1-10 keV (right panel). There are two soft X-ray sources within the BAT R95, WISEA J193714.86-401014.4 and LEDA 588288 with flux 1.2 × 10⁻¹² erg s−1 cm−2 and 6.5 × 10⁻¹² erg s−1 cm−2 respectively in the energy band 0.3-10 keV. The spectral fitting and power-law extrapolation predicts a flux of 1.1 × 10⁻¹² erg s−1 cm−2 and 6.1 × 10⁻¹⁰ erg s−1 cm−2 for WISEA J193714.86-401014.4 and LEDA 588288, respectively, in the energy band 15-150 keV, so we associated LEDA 588288 with the BAT source. |
5.1 Comparison to previous catalogs
Figure 5 compares the normalized source type distribution of counterparts identified in our analysis, with that of the PBC 100-month catalog and the BASS 105-month catalog. This comparison allows us to quantify systematic differences in source classifications that arise from improved sensitivity and follow-up completeness.
As can be seen, this work finds a much higher incidence of normal galaxies (>40%, compared to ∼10-20%) than previous catalogs. It is worth mentioning, however, that all 58 sources (see Table 3) that are detected by BAT and are classified as normal galaxies in the SIMBAD/NED databases are actually likely to be AGN. This is because BAT detects sources with high X-ray luminosities (> 1042 erg s−1) in a very hard energy range (15-150 keV). Normal galaxies generally do not have emission mechanisms capable of producing detectable X-ray emission at energies above 15 keV (see, e.g., Yamada et al. 2021 and Ricci et al. 2021), where even NuSTAR struggles to detect extreme starforming galaxies at <20 keV, in the absence of an AGN). This is further supported by the fact that we detect a much lower incidence of Sy1 (∼25% of sources, compared to ∼35-40%) and Sy2 galaxies (∼25% of sources, compared to ∼40% in the BASS 105-month catalog). Interestingly, the PBC 100-month catalog is affected by a similar issue between normal galaxies and Sy2s, which may be due to the BASS collaboration’s efforts to perform follow-up observations, which are likely responsible for the optical classification of a significant fraction of those sources (e.g., Lamperti et al. 2017; Koss et al. 2022; Oh et al. 2022).
Previous studies (Segreto et al. 2015; Oh et al. 2018) indicate that such BAT-detected normal galaxies, when indeed found to be AGN, tend to be more obscured than average galaxies. This could also be the reason some of them are missed or misclassified in surveys, which happens less frequently in Sy1 galaxies. As such, all sources listed as galaxies in this catalog are valuable targets for follow-up observations and, in particular, searches for highly obscured (and even Compton-thick) AGN (Akylas et al. 2016; Marchesi et al. 2019; Silver et al. 2022; Sengupta et al. 2023; Mohanadas & Annuar 2023).
We note that we only compare galaxies, Seyferts, and blazars to previous catalogs, but this work contains a significant number of counterparts classified as infrared (∼17%) and soft X-ray (∼18%) sources. Previous catalogs do not have significant populations of counterparts without an associated type, and thus we have not added these to the comparison. As can be seen in Table 3, the majority of these sources fall within the Galactic plane, making it impossible to determine their source type without a spectroscopic follow-up campaign. The 28 sources that fall outside of the plane, however, are likely to be AGN. The five radio sources outside the Galactic plane are most likely to be blazars.
Figure 6 presents a comparison between the normalized redshift distribution of the BAT AGN Spectroscopic Survey 105-month catalog (BASS 105-month catalog; Oh et al. 2018), the Palermo BAT 100-month catalog (PBC 100-month catalog; Segreto et al. 2015), and our study. The median redshift of the BASS 105-month catalog distribution is 0.044, and the lower (2.5th) and upper (97.5th) percentiles are 0.005 and 1.83, respectively. The median redshift of the PBC 100-month catalog distribution is 0.046, and the lower and upper percentiles are 0.003 and 1.64, respectively. In this work the median redshift of the distribution is 0.063, and the lower and upper percentile values are 0.0154 and 1.75, respectively.
This comparison shows that the median redshift of our sample is slightly higher than that of previous works, which is reasonable as the sources in our sample are fainter (since they were undetected within the first 100 months of BAT observations, but detected with an additional 50 months of observation) than the ones in the BASS 105-month catalog and PBC 100-month catalog. Since in the 15-150 keV energy band the effect of NH on the observed flux is marginal, we can assume that a fainter flux is related to a (slightly) higher redshift or to an intrinsically lower luminosity. Table 4 also shows the mean and median redshift of the catalogs.
The most recent Swift-BAT 157-month (Lien et al. 2025) catalog contains 1888 sources, including 256 new detections above the 4.8σ significance threshold. In that catalog, the BAT R95 positional uncertainty extends up to 12′, whereas in this work, we adopt an uncertainty radius of up to 6′. A cross-match between the selected counterparts (with 20″ max error) in this work and the counterparts to BAT sources in the Swift-BAT 157-month catalog identifies 48 counterparts in common. If, instead, we cross-match against the BAT source centroid and use the maximum error of 12 ′ (as considered by the 157-month catalog), we get 114 matches. This means that 114 of our counterparts could be counterparts to sources in the Swift-BAT 157-month catalog.
Out of these 114 sources, we find the following:
39 sources do not have a counterpart in the 157-month catalog, but have a counterpart in this work.
4 sources are unknown (no counterpart) in both the 157-month catalog and this work. In this case, the coordinates we are using to cross-match are of our BAT source detection and not those of a selected counterpart.
9 sources have counterparts in the 157-month catalog, but do not have one in our work. Of these, 8 sources are flagged as unassociated (ua) and 1 source is flagged as unobserved (uo) in this work. We attribute this to two main factors: 1) Some of the counterparts proposed in the 157-month catalog are at a distance >7′ from the BAT source centroid, while we consider a maximum R95 up to 6′. 2) The full BAT region is only partially covered by soft X-ray observations, and no X-ray counterpart is found. For those 9 sources, BASS 157 catalog has used an old association held over from the previous catalog (see Lien et al. (2025), and their proposed counterparts do indeed fall into the region not covered by soft X-rays.
The remaining 14 sources have different counterparts in the 157-month catalog compared to this work. The reasoning is similar to that of the previous point, i.e., different radii.
Figure 7 represents a histogram of the separation between the counterparts of the BAT sources presented in this work and 157-month BAT sources. Of these 114 sources, 89 are present within 6′ of the Swift-BAT 157-month catalog sources.
We note that the source detection methods employed by the BASS collaboration catalogs and the Palermo BAT catalogs are different, and that error estimates of the BAT data are nontrivial. This is likely the origin of some of the discrepancies in source detections between the different catalogs, particularly in this low signal-to-noise regime. It is not unexpected that not all the counterparts found in this work have an associated 157-month catalog BAT detection.
Counterpart types of BAT sources.
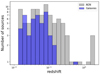 |
Fig. 3 Redshift distribution of 135 BAT detected sources for which redshift information was obtained thanks to the associations provided by our analysis. The AGN sources include Sy1/Sy2/SyG, AGN, and QSOs, whereas the Galaxies are galaxies in which AGN activity has not been reported until now. |
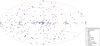 |
Fig. 4 All-sky map showing the classification of the 344 sources from BAT 150-month survey sources. The figure uses a Hammer-Aitoff projection in Galactic coordinates. |
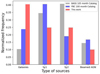 |
Fig. 5 Normalized source type comparison with PBC 100-month catalog and BASS 105-month catalog. The beamed AGN includes blazars, FSRQs, and QSOs. The galaxies are classified as unknown AGN in the BASS 105-month catalog. Based on their X-ray luminosity, we can safely claim that all the sources optically classified as galaxies actually host an AGN. |
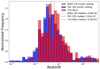 |
Fig. 6 Normalized comparison of redshift distribution for 135 out of 251 BAT detected sources from this work with 986 sources from the PBC 100-month catalog and with 966 sources from BASS 105-month catalog. The redshift distribution is similar to the PBC 100-month catalog and BASS 105-month catalog showing the accuracy of this work. |
Mean and median of redshift distribution.
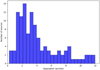 |
Fig. 7 Histogram of separation between the BAT counterparts in this work and the BAT coordinates of Swift-BAT 157-month catalog sources. 78% of the sources (89 out of 114) are present within 6′ of the Swift-BAT 157-month catalog sources. |
5.2 Positional accuracy
Figure 8 presents a plot illustrating the distribution of BAT sources as a function of the BAT offset (i.e., the separation between the BAT source centroid and the position of the counterpart) and the BAT R95. Among the 251 source counterparts, only 197 (78.5%) are located within their respective R95 regions, while 48 (19.1%) fall between R95 and 6′. Additionally, six sources (∼2.4% of the sample) are situated near the boundary of the 6′ circle, where the centroid of the soft X-ray detection lies outside the circle, but the emission extends into it. The median offset between the BAT source coordinates and the counterpart position is 2.85′, while the median radius of BAT R95 is 4.30′. While the majority of the sources are positioned below the 1:1 identity line, our comparison between the R95 and the 6’ radius (which was used for counterpart identification in previous iterations of the PBC, Segreto et al. 2010) demonstrates the existence of a small systematic uncertainty not accounted for in the R95 values. If R95 properly accounted for all sources of error, 95% of the counterparts would fall within it. Thus, we recommend using the 6’ radius when searching for counterparts within this catalog, as well as previous and future iterations of the PBC catalog.
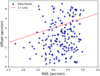 |
Fig. 8 Distribution of BAT sources with BAT offset and BAT R95. The angular separation between the counterpart position and the fitted BAT position is used to determine a measured BAT offset for each source. The majority of the sources lie below the identity line (1:1) indicating that most of the counterparts are well within the BAT R95. |
5.3 Cross-match with the 4FGL catalog
Table 3 lists two sources as GammaS. However, these are only classified as such by INTEGRAL (Bird et al. 2007) in NED/SIMBAD. Due to the bandpass of INTEGRAL (energy range 15 keV to 10 MeV, which fully includes the BAT energy range), these are more likely hard X-ray sources rather than genuine gamma-ray emitters. One of them (IGR J13045-5630) is only detected by BAT, Integral, and Swift-XRT and lies outside of the Galactic plane, making it likely to be an AGN of unknown type (including, potentially, a blazar; see e.g. Massaro et al. 2012). The other (SWIFT J042749.8-670434) is detected at both UV and IR wavelengths, but since it lies within the plane, its type is uncertain.
To obtain genuine gamma-ray counterparts to the newly detected sources, we cross-matched the catalog presented here against the Fermi 4FGL-DR4 catalog (Abdollahi et al. 2022; Ballet et al. 2023). To do so, we used our BAT counterpart positions and a 30″ uncertainty radius, against the 4FGL-DR4 catalog, considering the semimajor axis of their 95% uncertainty region. This reveals 13 sources with potential gamma-ray counterparts, as shown in Table 5. Among these, there are two known BL Lacs (blls), two sources classified as flat-spectrum radio quasars (fsrqs), two active galaxies of uncertain type (bcus, which are most likely blazars of uncertain type), two pulsars (PSRs), a globular cluster (glc), a low-mass X-ray binary (LMB), a possible association with a supernova remnant or a pulsar wind nebula (spp),and two unassociated 4FGL sources (4FGL J1816.1-3908 and 4FGL J2221.9+5955).
Table 5 lists both the BAT counterparts suggested in this work, and those reported in the 4FGL. Despite the different names used, 11/13 of them are known associations of the same source, and the separation between our XRT-detected X-ray counterpart and the counterpart reported in the 4FGL catalog is always ≲2″. The first exception is J1737.3+0235 (or 4FGL J1738.0+0236), for which we propose the radio source MITG J1737+0236 as the most likely counterpart, and the 4FGL lists PKS 1735+026. The two sources are separated by 6″, and are not associated with each other in SIMBAD. However, the Parkes Southern Radio Source Catalog (Wright & Otrupcek 1990) lists the detection error of MITG J1737+0236 to be as high as 20″, making it likely that even for this object, the two counterparts are in fact the same source. The radio source is most likely a double-lobedradio galaxy, hosted by Lacy et al. (2020).
The second exception is J1817.3-1642, for which we list an X-ray source of unknown origin (SWIFT J181723.1-164300) as the counterpart of the BAT source, while the 4FGL lists SNR G014.1-00.1 (a supernova remnant) as the most likely association, and PMN J1816-1649 (a radio source) as a less likely but still possible association. Neither of these two sources falls within the BAT 6′ uncertainty region, although the centroid of the supernova remnant (SNR) lies about ∼3′ away. The SNR is not detected in the Swift-XRT range, and the radio source, which lies more than 10′ away, is not covered by the observation. All three sources, however, fall within the R95 of the Fermi-LAT source. Due to its intense brightness and hardness in X-rays (average 0.3-10 keV flux ∼3 × 10⁻¹⁰ erg s−1 and Γ ∼ 1.5), as well as its BAT association, we suggest that SWIFT J181723.1-164300 is also a candidate counterpart to 4FGL J1816.2-1654c.
The coincidence of at least 10/11 of the BAT and 4FGL counterparts means that the spatial coincidence between a BAT and a 4FGL detection is unlikely coincidental. This implies that, for the last two sources in Table 5 (which lack an association in the 4FGL catalog), the listed BAT counterparts found in this work are likely to be associated with the Fermi source as well. They both lie in the Galactic plane, making it impossible to provide a likely source type without further multiwavelength follow-up observations.
Summary of the sources in our sample with a counterpart in the 4FGL-DR4 catalog.
5.4 Optical follow-up of unclassified counterparts
As mentioned in previous sections, a number of the associated counterparts are optically classified as galaxies or infrared sources. This is due to the lack of an available optical spectrum, which would most likely confirm their AGN nature, as well as provide a redshift measurement for them.
In this section we present the results of a short optical spectroscopic campaign, aimed at classifying nine of these sources. We intend to maintain an updated list of any new optical follow-ups on our website10.
Five of the sources were observed with the Southern Astrophysical Research (SOAR) telescope, using the Goodman High Throughput Spectrograph Clemens et al. (2004). The other four were observed using the Next Generation Palomar Spectrograph (NGPS) at the Hale Telescope. The results of the follow-up can be found in Table 6, where we list the BAT name, the counterpart name, and its optical type and redshift according to the spectra obtained. Figure 9 shows one of the NGPS spectra for reference, while the others can be found on the above-mentioned website.
We note that eight of the nine sources have a redshift above the median of all BAT catalogs (including the sample presented here), and five of them have redshift values that are among the highest of the BAT catalog for nonbeamed AGN (z > 0.2). For context, the highest-z Sy2 in the current Swift-BAT 157-month of Lien et al. (2025) has z = 0.5975, while WISEA J213603.27-162015.3 presented here has z = 0.611. Only 46 nonbeamed AGN (only 8 of which are Sy2) have z > 0.2, and only 19 are at z > 0.3. This highlights the importance of optical follow-ups of fainter BAT sources, similar to the ones presented in this work. Such campaigns are essential for identifying heavily obscured and higher-redshift AGN populations that are otherwise missed in shallower surveys.
Summary of the originally unclassified sources in our sample that were followed up with optical spectroscopy.
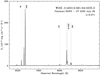 |
Fig. 9 NGPS spectrum of WISEA J140012.68+641635.0, showing the narrow lines typical of a Seyfert 2 AGN. |
6 Conclusions
The Swift-BAT 150-month catalog has a total of 2339 detected sources, of which 344 are new hard X-ray detected sources without a low-energy counterpart. In this work, we focus on characterizing these newly detected sources through extensive soft X-ray and multiwavelength follow-up.
This work benefited from an extensive analysis of soft (210 keV) X-ray data and cross-identification process to provide the classification for 250 of these 344 new objects, and to link them to optical/soft X-ray/infrared counterparts using data from Chandra, XMM-Newton, Swift-XRT, and eROSITA.
This catalog includes beamed AGN (blazars and FSRQs), nonbeamed AGN (galaxies), cataclysmic variable stars (CVs), pulsars, and young stellar objects, which are important references for many scientific studies. Follow-up observations of BAT sources have always been crucial for the scientific community. Berney et al. (2015) showed correlations between X-ray continuum emission and optical narrow emission lines based on the optical spectroscopic follow-up project (the BAT AGN Spectroscopic Survey; Koss et al. 2017). The relationship between optical narrow-line emission line ratios and the Eddington accretion rate was investigated by Oh et al. (2017). Lamperti et al. (2017) also explored near-infrared (NIR; 0.8-2.4 μm) spectroscopic properties of 102 Swift-BAT selected AGNs. Several works have investigated BAT sources to find and characterize obscured AGN (e.g., Marchesi et al. 2019; Zhao et al. 2019a,b; Torres-Albà et al. 2021; Zhao et al. 2021; Silver et al. 2022; Sengupta et al. 2023; Cox et al. 2025).
Future studies using this catalog, in combination with X-ray surveys (e.g., eROSITA, Chandra) and multiwavelength facilities (e.g., JWST, Rubin) will further refine our understanding of AGN demographics and their role in cosmic structure formation. This catalog thus serves as an important resource for advancing our knowledge of the hard X-ray sky and the physics of extreme astrophysical environments.
Data availability
The tables associated with this paper are available at the CDS via https://cdsarc.cds.unistra.fr/viz-bin/cat/J/A+A/709/A12.
Acknowledgements
The team acknowledge funding from NASA under contract 80NSSC22K1469. This research has made use of the SIMBAD database, operated at CDS, Strasbourg, France. This research has made use of the NASA/IPAC Extragalactic Database (NED), which is operated by the Jet Propulsion Laboratory, California Institute of Technology, under contract with the National Aeronautics and Space Administration. This research has made use of data and/or software provided by the High Energy Astrophysics Science Archive Research Center (HEASARC), which is a service of the Astrophysics Science Division at NASA/GSFC. This work is based on observations obtained with XMM-Newton, an ESA science mission with instruments and contributions directly funded by ESA Member States and NASA. This research has made use of data obtained from the Chandra Data Archive provided by the Chandra X-ray Center (CXC). This work is based on data from eROSITA, the soft X-ray instrument aboard SRG, a joint Russian-German science mission supported by the Russian Space Agency (Roskosmos), in the interests of the Russian Academy of Sciences represented by its Space Research Institute (IKI), and the Deutsches Zentrum für Luft- und Raumfahrt (DLR). The SRG spacecraft was built by Lavochkin Association (NPOL) and its subcontractors, and is operated by NPOL with support from the Max Planck Institute for Extraterrestrial Physics (MPE). The development and construction of the eROSITA X-ray instrument was led by MPE, with contributions from the Dr. Karl Remeis Observatory Bamberg & ECAP (FAU Erlangen-Nuernberg), the University of Hamburg Observatory, the Leibniz Institute for Astrophysics Potsdam (AIP), and the Institute for Astronomy and Astrophysics of the University of Tübingen, with the support of DLR and the Max Planck Society. The Argelander Institute for Astronomy of the University of Bonn and the Ludwig Maximilians Universität Munich also participated in the science preparation for eROSITA. This work is based on observations obtained at the Southern Astrophysical Research (SOAR) telescope, which is a joint project of the Ministério da Ciência, Tecnologia e Inovações (MCTI/LNA) do Brasil, the US National Science Foundation’s NOIRLab, the University of North Carolina at Chapel Hill (UNC), and Michigan State University (MSU). We thank the referee for the helpful feedback, that helped us in improving the paper. We thank Dr. H. Andernach for providing useful comments about potential radio counterparts to our sources.
References
- Abdollahi, S., Acero, F., Baldini, L., et al. 2022, ApJS, 260, 53 [NASA ADS] [CrossRef] [Google Scholar]
- Ajello, M., Greiner, J., Sato, G., et al. 2008a, ApJ, 689, 666 [Google Scholar]
- Ajello, M., Rau, A., Greiner, J., et al. 2008b, ApJ, 673, 96 [Google Scholar]
- Ajello, M., Costamante, L., Sambruna, R. M., et al. 2009, ApJ, 699, 603 [NASA ADS] [CrossRef] [Google Scholar]
- Akylas, A., Georgantopoulos, I., Ranalli, P., et al. 2016, A&A, 594, A73 [NASA ADS] [CrossRef] [EDP Sciences] [Google Scholar]
- Ananna, T. T., Treister, E., Urry, C. M., et al. 2019, ApJ, 871, 240 [Google Scholar]
- Anders, E., & Grevesse, N. 1989, Geochim. Cosmochim. Acta, 53, 197 [Google Scholar]
- Antonucci, R. R. J., & Miller, J. S. 1985, ApJ, 297, 621 [NASA ADS] [CrossRef] [Google Scholar]
- Arnaud, K. A. 1996, in Astronomical Society of the Pacific Conference Series, 101, Astronomical Data Analysis Software and Systems V, eds. G. H. Jacoby, & J. Barnes, 17 [Google Scholar]
- Ballet, J., Bruel, P., Burnett, T. H., Lott, B., & The Fermi-LAT collaboration. 2023, arXiv e-prints [arXiv:2307.12546] [Google Scholar]
- Barthelmy, S. D., Barbier, L. M., Cummings, J. R., et al. 2005, Space Sci. Rev., 120, 143 [Google Scholar]
- Baumgartner, W. H., Tueller, J., Markwardt, C. B., et al. 2013, ApJS, 207, 19 [Google Scholar]
- Berney, S., Koss, M., Trakhtenbrot, B., et al. 2015, MNRAS, 454, 3622 [CrossRef] [Google Scholar]
- Bird, A. J., Malizia, A., Bazzano, A., et al. 2007, ApJS, 170, 175 [Google Scholar]
- Burlon, D., Ghirlanda, G., Ghisellini, G., et al. 2008, ApJ, 685, L19 [NASA ADS] [CrossRef] [Google Scholar]
- Burrows, D. N., Hill, J. E., Nousek, J. A., et al. 2005, Space Sci. Rev., 120, 165 [Google Scholar]
- Cash, W. 1979, ApJ, 228, 939 [Google Scholar]
- Clemens, J. C., Crain, J. A., & Anderson, R. 2004, SPIE Conf. Ser., 5492, 331 [NASA ADS] [Google Scholar]
- Combes, F., García-Burillo, S., Audibert, A., et al. 2019, A&A, 623, A79 [NASA ADS] [CrossRef] [EDP Sciences] [Google Scholar]
- Cox, I. S., Torres-Albà, N., Marchesi, S., et al. 2025, ApJ, 979, 130 [Google Scholar]
- Cusumano, G., La Parola, V., Segreto, A., et al. 2010, A&A, 524, A64 [NASA ADS] [CrossRef] [EDP Sciences] [Google Scholar]
- Dadina, M. 2008, A&A, 485, 417 [NASA ADS] [CrossRef] [EDP Sciences] [Google Scholar]
- Flesch, E. W. 2023, Open J. Astrophys., 6, 49 [NASA ADS] [CrossRef] [Google Scholar]
- Fruscione, A., McDowell, J. C., Allen, G. E., et al. 2006, SPIE Conf. Ser., 6270, 62701V [Google Scholar]
- Gabriel, C. 2017, in The X-ray Universe 2017, eds. J.-U. Ness, & S. Migliari, 84 [Google Scholar]
- Giacconi, R., Gursky, H., Paolini, F. R., & Rossi, B. B. 1962, Phys. Rev. Lett., 9, 439 [NASA ADS] [CrossRef] [Google Scholar]
- Gilli, R., Comastri, A., & Hasinger, G. 2007, A&A, 463, 79 [NASA ADS] [CrossRef] [EDP Sciences] [Google Scholar]
- Hinkle, J. T., & Mushotzky, R. 2021, MNRAS, 506, 4960 [NASA ADS] [CrossRef] [Google Scholar]
- Hönig, S. F. 2019, ApJ, 884, 171 [Google Scholar]
- Jansen, F., Lumb, D., Altieri, B., et al. 2001, A&A, 365, L1 [NASA ADS] [CrossRef] [EDP Sciences] [Google Scholar]
- Koss, M. J., Assef, R., Balokovic, M., et al. 2016, ApJ, 825, 85 [Google Scholar]
- Koss, M., Trakhtenbrot, B., Ricci, C., et al. 2017, ApJ, 850, 74 [Google Scholar]
- Koss, M. J., Trakhtenbrot, B., Ricci, C., et al. 2022, ApJS, 261, 1 [NASA ADS] [CrossRef] [Google Scholar]
- Lacy, M., Baum, S. A., & Chandler, C. J. 2020, PASP, 132, 035001 [NASA ADS] [CrossRef] [Google Scholar]
- Lamperti, I., Koss, M., Trakhtenbrot, B., et al. 2017, MNRAS, 467, 540 [Google Scholar]
- Liang, E. P. T. 1979, ApJ, 231, L111 [Google Scholar]
- Lien, A. Y., Krimm, H. A., Markwardt, C. B., et al. 2025, ApJ, 989, 161 [Google Scholar]
- Marchesi, S., Ajello, M., Zhao, X., et al. 2019, ApJ, 872, 8 [Google Scholar]
- Marcotulli, L., Ajello, M., Urry, C. M., et al. 2022, ApJ, 940, 77 [NASA ADS] [CrossRef] [Google Scholar]
- Marinucci, A., Tamborra, F., Bianchi, S., et al. 2018, Galaxies, 6, 44 [Google Scholar]
- Massaro, F., Paggi, A., D’Abrusco, R., & Tosti, G. 2012, ApJ, 50, L35 [Google Scholar]
- Merloni, A., Lamer, G., Liu, T., et al. 2024, A&A, 682, A34 [NASA ADS] [CrossRef] [EDP Sciences] [Google Scholar]
- Mohanadas, P., & Annuar, A. 2023, Res. Astron. Astrophys., 23, 055002 [Google Scholar]
- Moretti, A., Campana, S., Tagliaferri, G., et al. 2004, SPIE Conf. Ser., 5165, 232 [Google Scholar]
- Nasa High Energy Astrophysics Science Archive Research Center 2014, HEA-soft: Unified Release of FTOOLS and XANADU, Astrophysics Source Code Library [record ascl:1408.004] [Google Scholar]
- Oh, K., Schawinski, K., Koss, M., et al. 2017, MNRAS, 464, 1466 [Google Scholar]
- Oh, K., Koss, M., Markwardt, C. B., et al. 2018, ApJS, 235, 4 [Google Scholar]
- Oh, K., Koss, M. J., Ueda, Y., et al. 2022, ApJS, 261, 4 [NASA ADS] [CrossRef] [Google Scholar]
- Predehl, P., Andritschke, R., Bornemann, W., et al. 2007, SPIE Conf. Ser., 6686, 668617 [Google Scholar]
- Predehl, P., Böhringer, H., Brunner, H., et al. 2010, in American Institute of Physics Conference Series, 1248, X-ray Astronomy 2009; Present Status, Multi-Wavelength Approach and Future Perspectives, eds. A. Comastri, L. Angelini, & M. Cappi (AIP), 543 [Google Scholar]
- Predehl, P., Andritschke, R., Arefiev, V., et al. 2021, A&A, 647, A1 [EDP Sciences] [Google Scholar]
- Ricci, C., & Trakhtenbrot, B. 2023, Nat. Astron., 7, 1282 [Google Scholar]
- Ricci, C., Walter, R., Courvoisier, T. J. L., & Paltani, S. 2011, A&A, 532, A102 [NASA ADS] [CrossRef] [EDP Sciences] [Google Scholar]
- Ricci, C., Ueda, Y., Koss, M. J., et al. 2015, ApJ, 815, L13 [Google Scholar]
- Ricci, C., Trakhtenbrot, B., Koss, M. J., et al. 2017, ApJS, 233, 17 [Google Scholar]
- Ricci, C., Privon, G. C., Pfeifle, R. W., et al. 2021, MNRAS, 506, 5935 [NASA ADS] [CrossRef] [Google Scholar]
- Schmitt, J. L. 1968, Nature, 218, 663 [NASA ADS] [CrossRef] [Google Scholar]
- Segreto, A., Cusumano, G., Ferrigno, C., et al. 2010, A&A, 510, A47 [NASA ADS] [CrossRef] [EDP Sciences] [Google Scholar]
- Segreto, A., Cusumano, G., La Parola, V., & Maselli, A. 2015, PoS, SWIFT 10, 132 [Google Scholar]
- Sengupta, D., Marchesi, S., Vignali, C., et al. 2023, A&A, 676, A103 [NASA ADS] [CrossRef] [EDP Sciences] [Google Scholar]
- Silver, R., Torres-Albà, N., Zhao, X., et al. 2022, ApJ, 940, 148 [NASA ADS] [CrossRef] [Google Scholar]
- Stein, W. A., O’Dell, S. L., & Strittmatter, P. A. 1976, ARA&A, 14, 173 [Google Scholar]
- Temple, M. J., Ricci, C., Koss, M. J., et al. 2023, MNRAS, 518, 2938 [Google Scholar]
- Toda, K., Fukazawa, Y., & Inoue, Y. 2020, ApJ, 896, 172 [Google Scholar]
- Torres-Albà, N., Marchesi, S., Zhao, X., et al. 2021, ApJ, 922, 252 [CrossRef] [Google Scholar]
- Tubín-Arenas, D., Krumpe, M., Lamer, G., et al. 2024, A&A, 682, A35 [NASA ADS] [CrossRef] [EDP Sciences] [Google Scholar]
- Ubertini, P., Bazzano, A., La Padula, C. D., et al. 1984, Adv. Space Res., 3, 211 [Google Scholar]
- Verner, D. A., Ferland, G. J., Korista, K. T., & Yakovlev, D. G. 1996, ApJ, 465, 487 [Google Scholar]
- Wang, C., Yu, L.-M., Bian, W.-H., & Zhao, B.-X. 2019, MNRAS, 487, 2463 [Google Scholar]
- Weisskopf, M. C., Brinkman, B., Canizares, C., et al. 2002, PASP, 114, 1 [NASA ADS] [CrossRef] [Google Scholar]
- Wright, A., & Otrupcek, R. 1990, PKS Catalog 1990, 0 [Google Scholar]
- Yamada, S., Ueda, Y., Tanimoto, A., et al. 2021, ApJS, 257, 61 [NASA ADS] [CrossRef] [Google Scholar]
- Zhao, X., Marchesi, S., & Ajello, M. 2019a, ApJ, 871, 182 [Google Scholar]
- Zhao, X., Marchesi, S., Ajello, M., et al. 2019b, ApJ, 870, 60 [Google Scholar]
- Zhao, X., Marchesi, S., Ajello, M., et al. 2021, A&A, 650, A57 [NASA ADS] [CrossRef] [EDP Sciences] [Google Scholar]
PI: Torres-Alba; proposal ID: 1821052.
However, the Swift-BAT 157-month catalog adopts a 12' radius to identify counterparts.
We exclude the two BL Lacs, one known blazar and one blazar candidate in our sample from the redshift range computation.
All Tables
Summary of the originally unclassified sources in our sample that were followed up with optical spectroscopy.
All Figures
|
Fig. 1 Swift-XRT observation of a single source (smaller circle) in the BAT R95 (bigger circle) for the BAT source J1130.5+6848 in the energy band 0.3-10 keV. Only one bright soft X-ray source (whose optical counterpart is the galaxy LEDA 139586) is present within the BAT R95, which we identify as the BAT counterpart. |
| In the text | |
|
Fig. 2 Swift-XRT observation for the BAT source J1937.4-4013 in the energy band 0.3-5 keV (left panel) and 5.1-10 keV (right panel). There are two soft X-ray sources within the BAT R95, WISEA J193714.86-401014.4 and LEDA 588288 with flux 1.2 × 10⁻¹² erg s−1 cm−2 and 6.5 × 10⁻¹² erg s−1 cm−2 respectively in the energy band 0.3-10 keV. The spectral fitting and power-law extrapolation predicts a flux of 1.1 × 10⁻¹² erg s−1 cm−2 and 6.1 × 10⁻¹⁰ erg s−1 cm−2 for WISEA J193714.86-401014.4 and LEDA 588288, respectively, in the energy band 15-150 keV, so we associated LEDA 588288 with the BAT source. |
| In the text | |
|
Fig. 3 Redshift distribution of 135 BAT detected sources for which redshift information was obtained thanks to the associations provided by our analysis. The AGN sources include Sy1/Sy2/SyG, AGN, and QSOs, whereas the Galaxies are galaxies in which AGN activity has not been reported until now. |
| In the text | |
|
Fig. 4 All-sky map showing the classification of the 344 sources from BAT 150-month survey sources. The figure uses a Hammer-Aitoff projection in Galactic coordinates. |
| In the text | |
|
Fig. 5 Normalized source type comparison with PBC 100-month catalog and BASS 105-month catalog. The beamed AGN includes blazars, FSRQs, and QSOs. The galaxies are classified as unknown AGN in the BASS 105-month catalog. Based on their X-ray luminosity, we can safely claim that all the sources optically classified as galaxies actually host an AGN. |
| In the text | |
|
Fig. 6 Normalized comparison of redshift distribution for 135 out of 251 BAT detected sources from this work with 986 sources from the PBC 100-month catalog and with 966 sources from BASS 105-month catalog. The redshift distribution is similar to the PBC 100-month catalog and BASS 105-month catalog showing the accuracy of this work. |
| In the text | |
|
Fig. 7 Histogram of separation between the BAT counterparts in this work and the BAT coordinates of Swift-BAT 157-month catalog sources. 78% of the sources (89 out of 114) are present within 6′ of the Swift-BAT 157-month catalog sources. |
| In the text | |
|
Fig. 8 Distribution of BAT sources with BAT offset and BAT R95. The angular separation between the counterpart position and the fitted BAT position is used to determine a measured BAT offset for each source. The majority of the sources lie below the identity line (1:1) indicating that most of the counterparts are well within the BAT R95. |
| In the text | |
|
Fig. 9 NGPS spectrum of WISEA J140012.68+641635.0, showing the narrow lines typical of a Seyfert 2 AGN. |
| In the text | |
Current usage metrics show cumulative count of Article Views (full-text article views including HTML views, PDF and ePub downloads, according to the available data) and Abstracts Views on Vision4Press platform.
Data correspond to usage on the plateform after 2015. The current usage metrics is available 48-96 hours after online publication and is updated daily on week days.
Initial download of the metrics may take a while.