Fig. 6
Download original image
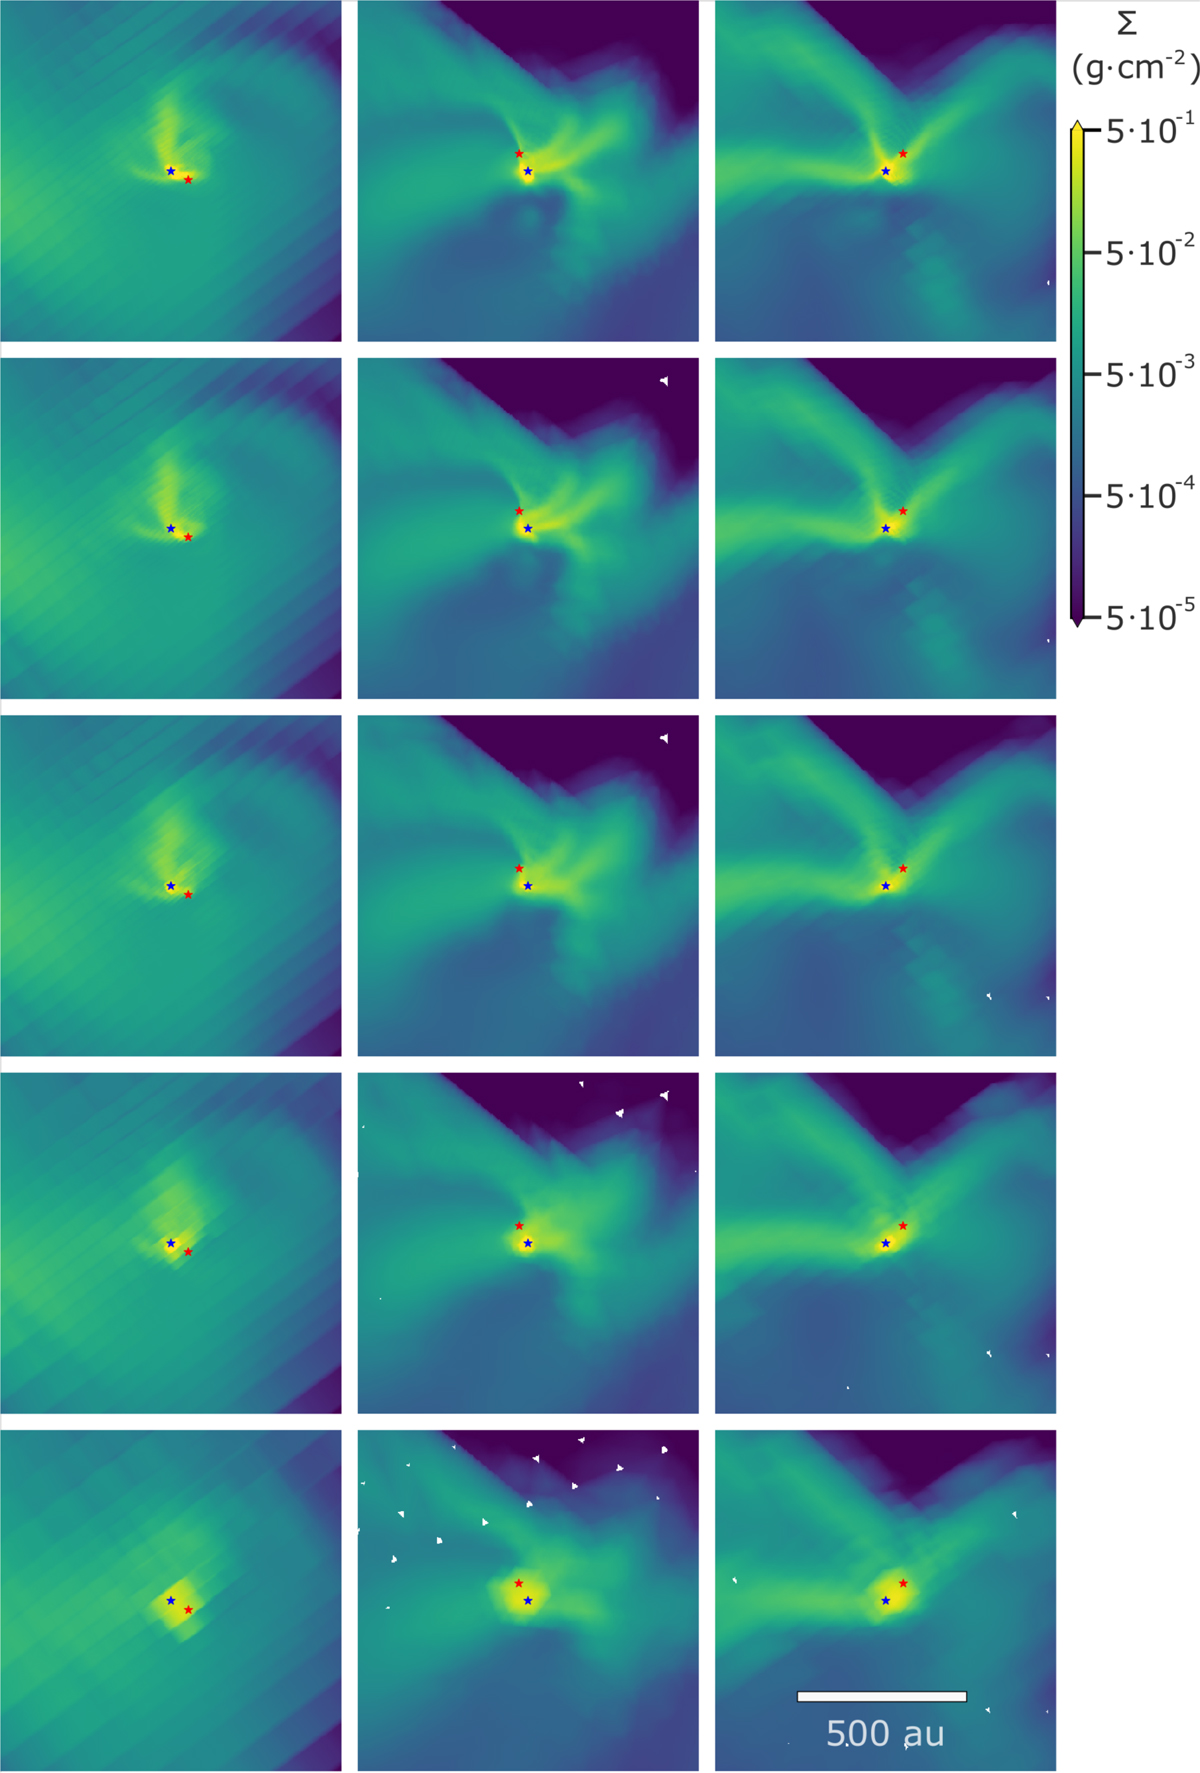
Column density plot on the 3 axes of the primary sink particle in a 1000 AU by 1000 AU field of view, where the primary sink is the blue star and the secondary is the red star. The resolution goes from levelmax = 14 at the bottom panel to levelmax = 18 at the top in steps of 1. It shows the complex surroundings of pair 257, 260 and how with increasing resolution the gas flow to the individual sinks becomes mostly resolved.
Current usage metrics show cumulative count of Article Views (full-text article views including HTML views, PDF and ePub downloads, according to the available data) and Abstracts Views on Vision4Press platform.
Data correspond to usage on the plateform after 2015. The current usage metrics is available 48-96 hours after online publication and is updated daily on week days.
Initial download of the metrics may take a while.