Open Access
Fig. 5
Download original image
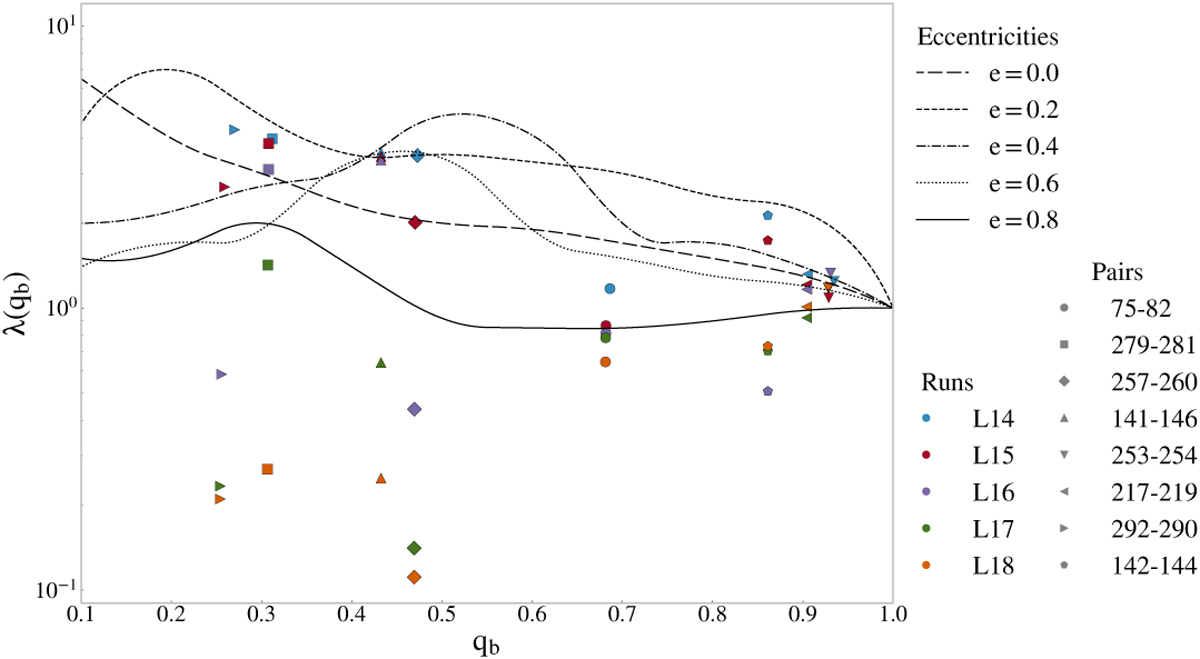
Average λ of each pair in each run as a function of the mass ratio. The colour indicates the resolution of the run, and the symbol identifies which pair it represents. The lines are the same as those in Fig. 1.
Current usage metrics show cumulative count of Article Views (full-text article views including HTML views, PDF and ePub downloads, according to the available data) and Abstracts Views on Vision4Press platform.
Data correspond to usage on the plateform after 2015. The current usage metrics is available 48-96 hours after online publication and is updated daily on week days.
Initial download of the metrics may take a while.